#COVID19 UPDATE THREAD – APRIL 1
All graphics are 7-day averages. Today’s raw reporting for each metric is in the tweet below.
(Data retrieved directly from state dashboards. Not every state updates its numbers daily.)
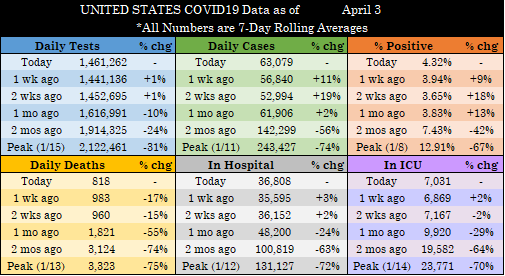
UNITED STATES
All graphics are 7-day averages. Today’s raw reporting for each metric is in the tweet below.
(Data retrieved directly from state dashboards. Not every state updates its numbers daily.)
UNITED STATES

Today’s raw reported metrics:
- Tests: 1,824,684 (+174,702)
- Cases: 73,006 (+10,373)
- Deaths: 1,020 (-239)
- Currently Hospitalized: 37,203 (-190)
- Currently in ICU: 7,079 (-86)
(+/- compared to same day last week for Tests/Cases/Deaths & yesterday for Hosp/ICU)
- Tests: 1,824,684 (+174,702)
- Cases: 73,006 (+10,373)
- Deaths: 1,020 (-239)
- Currently Hospitalized: 37,203 (-190)
- Currently in ICU: 7,079 (-86)
(+/- compared to same day last week for Tests/Cases/Deaths & yesterday for Hosp/ICU)
Average reported daily deaths fell below 900 today for the first time since 11/5. And they’re likely even lower. MI added 33 matching deaths today. WV had about the same yesterday. And look CA’s dates for the 154 reported today:
https://twitter.com/CohoKelly/status/1377721327398834181?s=20
With actual daily deaths lower, and logistical time potentially freeing up, several states will likely continue to audit, match, update, etc. their death numbers. We’ll pull them out of trend data if they are massive dumps, but it’s just too much work to keep up with each one.
This means 2 things: (1) we should see a sharper decline once most states are reporting only recent(ish) deaths, and (2) the late fall/winter death toll was worse than the reporting at the time indicated. But brighter days should be in our very near future.
Here’s today’s vaccine update. We’re sneaking up on that 3M number, and it seems like we’ll see it any day now.
https://twitter.com/CohoKelly/status/1377673513570598915?s=20
I’ll get the regionals out tonight. Give me a little bit.
MICHIGAN

TEXAS

CALIFORNIA

FLORIDA

SOUTHEAST
(AL, AR, GA, KY, LA, MS, NC, SC, TN)
(AL, AR, GA, KY, LA, MS, NC, SC, TN)

SOUTHWEST
(AZ, NM, NV, OK, UT)
(AZ, NM, NV, OK, UT)

PACIFIC NORTHWEST/ROCKIES
(CO, ID, MT, OR, WA, WY)
(CO, ID, MT, OR, WA, WY)

GREAT PLAINS
(IA, KS, MN, MO, ND, NE, SD)
(IA, KS, MN, MO, ND, NE, SD)

GREAT LAKES
(IL, IN, OH, WI)
*Removed MI from trend data, but peaks still include MI data
(IL, IN, OH, WI)
*Removed MI from trend data, but peaks still include MI data

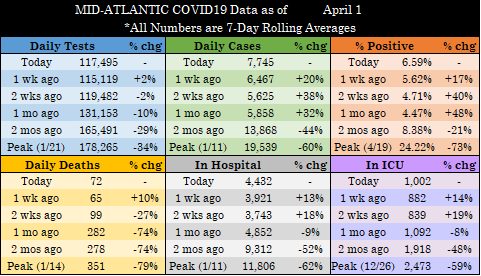
MID-ATLANTIC
(DC, DE, MD, PA, VA, WV)
(DC, DE, MD, PA, VA, WV)
NORTHEAST
(CT, MA, ME, NH, NJ, NY, RI, VT)
(CT, MA, ME, NH, NJ, NY, RI, VT)

• • •
Missing some Tweet in this thread? You can try to
force a refresh