
#COVID19 UPDATE THREAD – APRIL 3
All graphics are 7-day averages. Today’s raw reporting for each metric is in the tweet below.
(Data retrieved directly from state dashboards. Not every state updates its numbers daily.)
UNITED STATES
All graphics are 7-day averages. Today’s raw reporting for each metric is in the tweet below.
(Data retrieved directly from state dashboards. Not every state updates its numbers daily.)
UNITED STATES
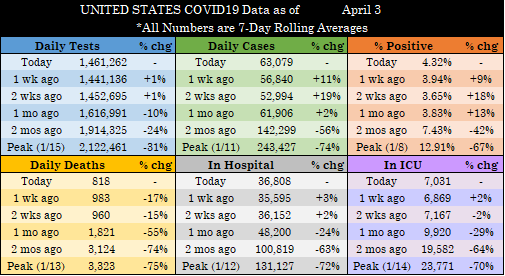
Today’s raw reported metrics:
- Tests: 1,620,530 (+90,643)
- Cases: 66,023 (+9,090)
- Deaths: 758 (-57)
- Currently Hospitalized: 36,913 (-398)
- Currently in ICU: 7,003 (-47)
(+/- compared to same day last week for Tests/Cases/Deaths & yesterday for Hosp/ICU)
- Tests: 1,620,530 (+90,643)
- Cases: 66,023 (+9,090)
- Deaths: 758 (-57)
- Currently Hospitalized: 36,913 (-398)
- Currently in ICU: 7,003 (-47)
(+/- compared to same day last week for Tests/Cases/Deaths & yesterday for Hosp/ICU)
As I said last night, we’re looking at volatility for a little while (see quoted thread). And this isn’t just a holiday thing, but a Sat-Mon thing going forward. States’ weekend reporting has become spotty and inconsistent.
https://twitter.com/TheLawyerCraig/status/1378029141610627078?s=20
Take PA, for example. It didn't report cases Saturday and Sunday last week, but reported over 5K cases today, so it accounts for over half of our increase in the raw numbers above (and just adding MI’s increase today more than makes up for the national 9K jump).
Also, I pulled 51 death certificate matching reported deaths out of MI’s numbers today (pic of site). This is the third day *this week* that MI has posted some audit-type deaths (I think the others were 20-something and 30-something deaths). There are 2 reasons I tell you this:

(1) Transparency. I’ve always said I try to pull out non-current dumps when significant enough and easily identifiable. “But 7 average deaths (51 divided by 7) isn’t a big delta, Craig.” True. But I didn’t pull out either of the other two, and it’s getting cumulative.
And...
And...
(2) I suspect soon you will see folks reporting Michigan’s “rising death toll” based on these 3 cert-matching dumps. This is an increase of 14-15 average daily deaths due solely to matching and not the recent wave—enough to make it appear about double the pipeline number.
Because all of you who follow my updates know what’s what in terms of how data is reported, you’ll know how to politely correct those who parrot silly “deaths have doubled in MI” stories. That narrative won’t be stopped anyway, but hey, at least some can strive for accuracy.
Finally—today’s vaccine update. We finally hit 3M+ doses per day in the 7-day average.
https://twitter.com/CohoKelly/status/1378401721077149701?s=20
In other vaccine news, I will be getting my J&J shot this Tuesday!
In honor of my upcoming vaccine, and because I have loads of weekend work to do, no regionals tonight. Sorry!
I TAKE IT BACK! I just happened to notice that Texas, for (I believe) the first time during the pandemic, has dropped below 4% positive. So I may as well at least give you that one...

• • •
Missing some Tweet in this thread? You can try to
force a refresh


