For those who follow my daily #Covid19 data updates, it's time for another period of likely volatility based on holiday reporting. Based on past holidays, here's what should happen:

(Thread)
Starting as early as today, reported numbers for tests, cases, and deaths will likely be lower than they would otherwise have been without a holiday.

This does *not* necessarily mean that (1) they will drop, or (2) every state/region will see the same amount of volatility.
This artificial deflation will likely continue through ~Tuesday of next week.

Then, the opposite happens! For 3-4 days, states generally report their current "pipeline" numbers PLUS any backlog numbers. We should see that from ~Wed-Sat of next week.
But it doesn't end there. Because I report 7-day averages, those averages end up higher than they otherwise would have been for the 3-4 days following the backlog reporting. Why? Because when you have 3 days normal + backlog & 4 days normal, the totals (and averages) are higher.
So the entire volatility period generally doesn't end for ~2 weeks from when it started. Here's a cheat sheet:

4/2 - Begin artificial low reporting
4/7 - Begin artificial high
4/10 - Normal reporting
4/16 - Full week of normal (7-day average should even out by today)
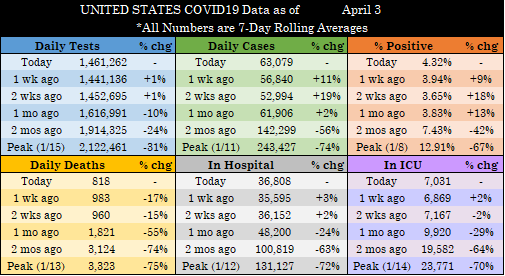
Generally, the hospitalization and ICU numbers don't see holiday volatility to nearly the same extent. There is always a weekend dip (compared to trend), and that can get exacerbated a bit by the holidays, but usually sorts itself out much more quickly.
Just keep the above in mind before trumpeting to the world "We're heading back down!" on 4/6, or "OMG did you see the rising case count in [State]!?" on 4/8, or "Wow, that 7-day average is SCARY!" on 4/12.

Be an elevated data connoisseur instead...

• • •

Missing some Tweet in this thread? You can try to force a refresh
 

Keep Current with Craig

Craig Profile picture

Stay in touch and get notified when new unrolls are available from this author!

Read all threads

This Thread may be Removed Anytime!

PDF

Twitter may remove this content at anytime! Save it as PDF for later use!

Try unrolling a thread yourself!

how to unroll video
  1. Follow @ThreadReaderApp to mention us!

  2. From a Twitter thread mention us with a keyword "unroll"
@threadreaderapp unroll

Practice here first or read more on our help page!

More from @TheLawyerCraig

3 Apr
#COVID19 UPDATE THREAD – APRIL 3

All graphics are 7-day averages. Today’s raw reporting for each metric is in the tweet below.

(Data retrieved directly from state dashboards. Not every state updates its numbers daily.)

UNITED STATES Image
Today’s raw reported metrics:

- Tests: 1,620,530 (+90,643)

- Cases: 66,023 (+9,090)

- Deaths: 758 (-57)

- Currently Hospitalized: 36,913 (-398)

- Currently in ICU: 7,003 (-47)

(+/- compared to same day last week for Tests/Cases/Deaths & yesterday for Hosp/ICU)
As I said last night, we’re looking at volatility for a little while (see quoted thread). And this isn’t just a holiday thing, but a Sat-Mon thing going forward. States’ weekend reporting has become spotty and inconsistent.
Read 12 tweets
2 Apr
#COVID19 UPDATE THREAD – APRIL 2

All graphics are 7-day averages. Today’s raw reporting for each metric is in the tweet below.

(Data retrieved directly from state dashboards. Not every state updates its numbers daily.)

UNITED STATES Image
Today’s raw reported metrics:

- Tests: 1,683,615 (-271,539)

- Cases: 65,599 (-7,631)

- Deaths: 944 (-461)

- Currently Hospitalized: 37,311 (+108)

- Currently in ICU: 7,050 (-29)

(+/- compared to same day last week for Tests/Cases/Deaths & yesterday for Hosp/ICU)
Before popping the cork at seeing those large minus signs in key metrics, please read my thread from earlier today (quoted). As if on cue, a few states that normally report on Fridays didn’t report at all. Others likely reported less-than-complete data.
Read 17 tweets
1 Apr
#COVID19 UPDATE THREAD – APRIL 1

All graphics are 7-day averages. Today’s raw reporting for each metric is in the tweet below.

(Data retrieved directly from state dashboards. Not every state updates its numbers daily.)

UNITED STATES Image
Today’s raw reported metrics:

- Tests: 1,824,684 (+174,702)

- Cases: 73,006 (+10,373)

- Deaths: 1,020 (-239)

- Currently Hospitalized: 37,203 (-190)

- Currently in ICU: 7,079 (-86)

(+/- compared to same day last week for Tests/Cases/Deaths & yesterday for Hosp/ICU)
Average reported daily deaths fell below 900 today for the first time since 11/5. And they’re likely even lower. MI added 33 matching deaths today. WV had about the same yesterday. And look CA’s dates for the 154 reported today:
Read 18 tweets
26 Mar
#COVID19 UPDATE THREAD – MARCH 26

All graphics are 7-day averages. Today’s raw reporting for each metric is in the tweet below.

(Data retrieved directly from state dashboards. Not every state updates its numbers daily.)

UNITED STATES
Today’s raw reported metrics:

- Tests: 1,955,154 (+115,523)

- Cases: 73,230 (+11,036)

- Deaths: 1,405 (+84)

- Currently Hospitalized: 35,969 (+40)

- Currently in ICU: 6,936 (-47)

(+/- compared to same day last week for Tests/Cases/Deaths & yesterday for Hosp/ICU)
Big jump in cases from last Friday to this (and a fairly large jump in tests too). Today wraps up our first plateau/mini-rise week since we started down in late-ish January. The Northeast, Mid-Atlantic, and Great Lakes have generally led the rise, with Michigan on a rocket ship.
Read 6 tweets
26 Mar
The regional trends in #COVID19 metrics seem to pretty clearly have a geographical or climatological tie. The states in RED have the largest recent percentage increase in positive testing %. The states in GREEN have the largest percentage decrease.
Here's the same map, but for improvement in current hospitalizations (as a % increase/decrease). Again, RED is least improvement (or in some cases, increasing numbers). GREEN is most improvement.
One positive note: only 4 states showed current hospitalizations higher as of yesterday's data than they did on March 5, so most of the RED states above are still showing declines.
Read 4 tweets
26 Mar
#COVID19 UPDATE THREAD – MARCH 25

All graphics are 7-day averages. Today’s raw reporting for each metric is in the tweet below.

(Data retrieved directly from state dashboards. Not every state updates its numbers daily.)

UNITED STATES
Today’s raw reported metrics:

- Tests: 1,649,982 (-98,511)

- Cases: 62,633 (+276)

- Deaths: 1,259 (+57)

- Currently Hospitalized: 35,929 (-179)

- Currently in ICU: 6,983 (+32)

(+/- compared to same day last week for Tests/Cases/Deaths & yesterday for Hosp/ICU)
Fairly low movement today in the national numbers, though that masks what continues to be varied regional trends. I’m already looking forward to next week though—curious as to whether our plateau/mini-rise starts to bend back downwards or hangs around a while longer.
Read 16 tweets

Did Thread Reader help you today?

Support us! We are indie developers!


This site is made by just two indie developers on a laptop doing marketing, support and development! Read more about the story.

Become a Premium Member ($3/month or $30/year) and get exclusive features!

Become Premium

Too expensive? Make a small donation by buying us coffee ($5) or help with server cost ($10)

Donate via Paypal Become our Patreon

Thank you for your support!

Follow Us on Twitter!