I keep doing threads on Mumbai's shocking COVID situation. Another longish one - sorry!
1) Active infection is at eye-watering levels.
2) Everything has happened fast, and things are not yet improving.
3) Modelling can't explain the current surge without new assumptions.
🧵
1) Active infection is at eye-watering levels.
2) Everything has happened fast, and things are not yet improving.
3) Modelling can't explain the current surge without new assumptions.
🧵
Before any details, a general point about modellers and models. They've got many things wrong during this pandemic. Some embarrassingly wrong. Models keep having to be rewritten. BUT models build and challenge intuition in a way data crunching alone can't - at least for me...
The models didn't find Mumbai's second wave (Sept-Oct 2020) surprising. They said weakening restrictions & uneven spread could cause such a surge. It hit nonslums harder than the first, and slums much less than the first (as expected). It added fewer infections than the first.
But my models did not see the third surge coming. They suggested that full opening up (no more NPIs) would lead to a surge, but limited in scale and fairly minor in the slums. Even despite slow waning of immunity & high slum R0. Only watching Manaus' story unfold was worrying.
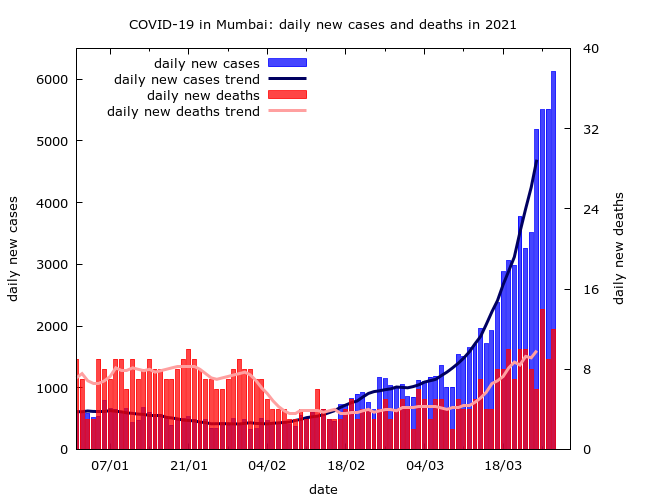
Mumbai's surge is anything but slow and limited. Here are some estimates. Right now:
The chances of being infected in a given week are astronomical: >15% if you are a slum dweller and >7% otherwise.
R0 is very high (probably 1.7 or more) and not yet going down.
The chances of being infected in a given week are astronomical: >15% if you are a slum dweller and >7% otherwise.
R0 is very high (probably 1.7 or more) and not yet going down.
How much active infection is around? In the last week Mumbai found 63K cases (9K per day). An estimated 16K of these were from the slums. Test +vity was ~20%. Half of tests were rapid - if all had been PCR (as they were early last year) +vity would probably be around 26%. 

26% is higher than the average test +vity upto early July, 2020 - over the first wave. During this period only about 0.8% of slum infections and 5.9% of housing society infections were detected. There is evidence detection greatly improved after July when test +vity dropped.
How closely is detection related to test +vity? We don't know. But if we're back at weak first wave detection, then last week saw 2M new slum infections (30% of the slum pop) and 8 lakh new nonslum ones (13% of the nonslum pop). That's hard to swallow, so let's be optimistic...
Suppose detection is 2X higher now despite high +vity (for some reason). Even then, 15% were infected in the slums & 7% in nonslums last week. If infection is "active" for 7 days, it would mean that 10% of the city is actively infected right now. Is this even possible?
Yes. It seems much of the city's rapid testing is random. And RAT +vity is >10%. Remember, 7 of 67 (10%) of vegetable sellers were found +ve at one market using rapid tests? That was March 23 when the situation was less dire.
mumbaimirror.indiatimes.com/coronavirus/ne…
mumbaimirror.indiatimes.com/coronavirus/ne…
So there's incredibly high active infection. Which brings us to Point (2): it happened fast and is still not slowing.
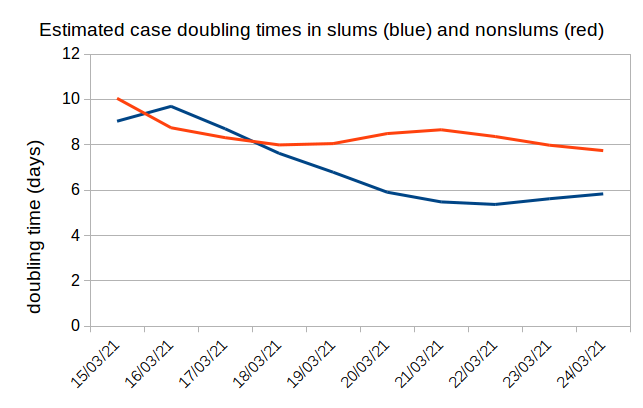
Case doubling time is about 9 days right now, and hasn't dropped below 14 days since March 12. That's consistent, rapid growth. But the reality is worse...
Case doubling time is about 9 days right now, and hasn't dropped below 14 days since March 12. That's consistent, rapid growth. But the reality is worse...


...because test +vity has been rising fast, it's very likely that daily infections have been growing faster than cases suggest. There's uncertainty, but my estimates suggest that daily infections have been doubling in less than 7 days for the last 2 weeks. That's R ~ 1.7 or more.
Now, whatever you believe about prior infection in the city (my median estimate: 60%), R ~ 1.7 is shocking. So to point (3) - what does modelling say? I've run several different models of Mumbai over the past year, including a 2 compartment agent-based model (not yet on github).
The 2 compartment model can explain 2020 data. The data was consistent with slums having a much higher R0 (4 to 5) than the nonslum areas (2 to 3). Transmission was slowed by lockdown, but still rapid in the slums. Lockdown largely "uncoupled" the slums and nonslums.
The way slum infections weren't fading away at the end of the year made me introduce (slowly) waning immunity into the model. I believe that understanding transmission at the tail end of 2020 required some waning immunity. But not much, and not rapid. What about this surge?
The model can't reproduce the city's third surge. Decreasing NPIs to zero and allowing low level, steadily waning immunity aren't enough for a surge of this speed and scale. I suspect the data could be reproduced by introducing a much more transmissible or immune escape variant.
I would be curious to know if anyone running any models (deterministic or stochastic, differential equation or agent based...) is able to reproduce the city's data without introducing a more transmissible variant and/or increasing susceptibility (e.g., immune escape).
Finally, what about restrictions and vaccinations? There are now various restrictions in place, and most people are aware of the worrying situation. Fingers crossed, cases & test +vity will start to fall in the next week. Vaccination will reduce deaths in the city...
..but vaccination coverage is just not high enough yet, even amongst the most vulnerable. The huge pool of active infection still has to work its way through households. There are, sadly, a lot of hospitalisations & fatalities still to come.
(n/n)
(n/n)
• • •
Missing some Tweet in this thread? You can try to
force a refresh