I’ve been getting increasingly confident in recent weeks that we’re on the right path to defeating B.1.1.7 in the UK, and stand a good chance of ‘unlocking’ in May/June with a no exit wave, or a very small one. But there’s one thing still bothering me: new variants. 1/
Up ‘til now, I’ve not been sure how worried to be about these. Many people (including some whose opinions and expertise I trust) tell me not to worry, there won’t be much ‘immunity escape’, and in any event T-cells will ensure that we remain protected vs. severe disease. 2/
But the questions still bothering me are: 1) how much ‘immunity escape’ would be needed to cause a problem? 2) and how likely is that to occur? I can’t answer the second question – that’s one for the virologists and immunologists – but I can have a go at the first. 3/
So I’ve enhanced my vaccine model to analyse this, and after a few days of modelling and analysis work, I have four key insights for you: 4/
1. Small ‘escapes’ (i.e. a reduction in vaccine efficacy vs. infection, or vs. severe disease) can create large waves with many thousands of deaths. This is because we will be precariously positioned just above the herd immunity threshold, with little margin for error. 5/
2. Seasonality may help a bit – but mostly in buying us time to find other solutions (e.g. vaccine boosters). And maintaining baseline controls (such as TTI, masks etc.) after the point where we unlock in June can limit the downside risks, but doesn’t remove the problem. 6/
3. As well as vaccine/immunity escape, a lot depends on the R0 and IFR of the variant. If it’s like B.1.1.7 we don’t have much leeway for escape. But if it’s more like the old 'wildtype' in terms of R0 and IFR, we can afford more vaccine escape before things get messy. 7/
4. Hence we need to be vigilant, tracking the latest variant data both overseas and in the UK, and be ready to deploy vaccine boosters and other contingencies if needed to counter-act the effect of a variant with material ‘vaccine escape’ that does gain ground in the UK. 8/
That’s the end of the summary; if you’re interested in how I arrived at those insights, and the details of the analysis, please read on. (it’s a bit long, but I promise there’s no complex maths and there are some colourful charts to keep you engaged along the way). 😀 9/
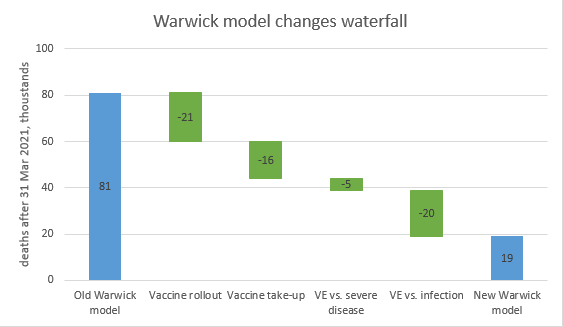
Many of you are familiar with the model that I’ve been using to explore the size and shape of the exit wave, and the ins & outs of the SPI-M (Warwick & Imperial) models. And with a few days’ work, I’ve enhanced that model to handle new variants. 10/
https://twitter.com/JamesWard73/status/1377640517379497987?s=20
It can only do one variant at a time, so I’ve put in a switch that flips to a new dominant variant in early September 2021, with changed VE assumptions (vs. infection and vs. severe disease), and also the ability to change R0 and IFR for the new variant. 11/
A few technical notes: 1) the model also changes the way infection-acquired immunity works, consistent with the changes to VE. 2) changes to VE are expressed in relative % terms; this means a 20% reduction causes an existing 60% VE to move to 48% (not 40%) 12/
3) the change in VE vs severe disease is constrained to be less (in % terms) than the change in VE vs. infection – because for it to be larger feels implausible, and can also create some odd effects in the model.
4) the same % change in VE is applied to all vaccines 13/
4) the same % change in VE is applied to all vaccines 13/
5) when we change the VE vs. infection, we don’t change the assumption on transmission reduction for post-vaccination infections (and re-infections). This remains at a 50% reduction, for all people who gain protection vs. severe disease, but don’t have sterilising immunity. 14/
Now you’re ready to see some results, I think. You may have been thinking, as I was, that small % changes to the VE might not make a big difference. So let’s try say a 20% reduction in VE vs. infection, and a 10% reduction in VE vs. severe disease. 15/ 
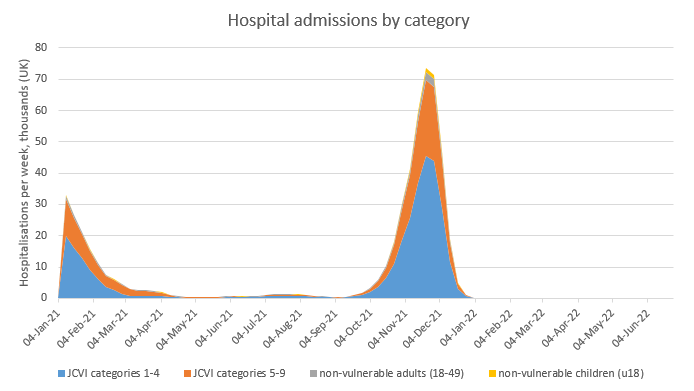
Hmmm. That’s about 70k deaths in the wave, and a peak of hospitalisations over twice what we saw in January. Not good at all. But let’s say we don’t lose any VE vs. severe disease, but a bit more (25%) vs infection, what happens then? 16/
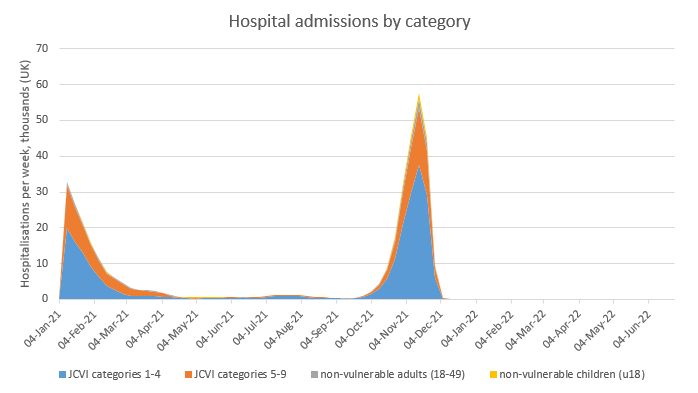
So, that’s fewer deaths (more like 45k) but still significant, and also still with a nasty peak of hospitalisations that would threaten to overwhelm NHS capacity. So far, this isn’t looking pretty at all. 17/
To save us going through every scenario I’ve built a table which shows, for each combination of VE reduction vs. severe disease, and VE reduction vs. infection, the results in terms of deaths (in thousands). Two important notes: 18/
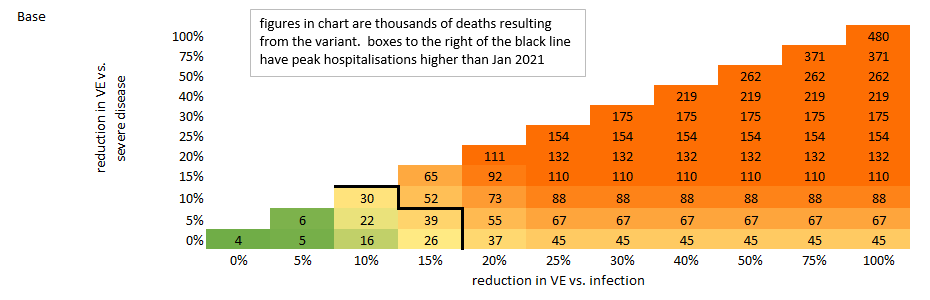
1) The thick black line corresponds to the January 2021 peak of hospitalisations, which is my rough gauge for NHS capacity – so any scenarios to the left of that line have lower peak admissions than January. And to the right, higher. 19/
2) The colour scheme doesn’t imply a value judgment, it’s just there to make the numbers easier to read. So please don’t think that because a number has a tinge of green in the background, that means I think it’s OK or acceptable. I’ll leave those judgments to others. 20/
What do we learn from this? As we’ve already seen, the outcomes can start to look nasty even with relatively small (e.g. 10-15%) movements in VE. And after 25% loss of VE vs. infection, further losses make no difference – the outcome is driven by the VE vs. severe disease. /21
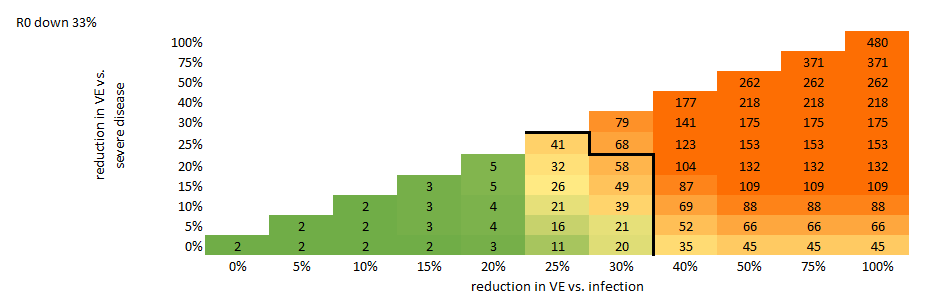
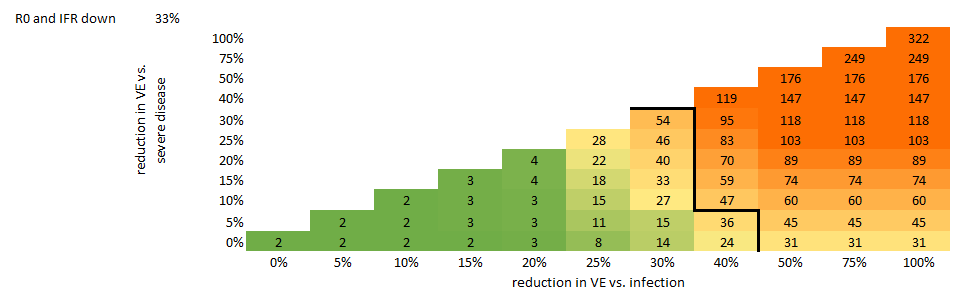
You may recall that I said we could vary the R0 and IFR of the new variant. So let’s do that, moving the R0 down by 33% (back to the old wildtype level of ~2.9): here things look a bit better, with relatively little pain from changes in VE vs. infection of up to 20%. /22
Going the other way, and moving R0 up by 33% (so it would then be around 5.7, or roughly double the old wildtype level), has predictably nasty consequences – there is really no leeway at all, with significantly increased deaths coming even with no vaccine/immunity escape. /23

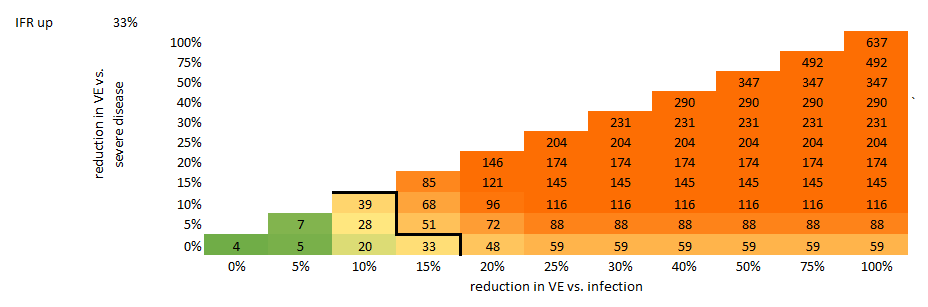
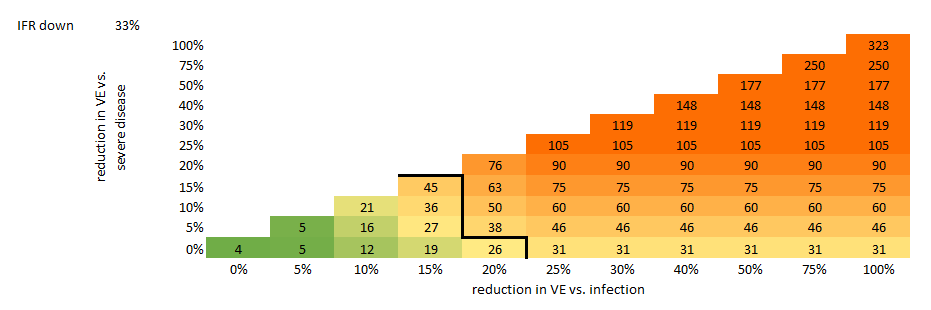
Moving IFR is a bit more straightforward, as it simply multiplies the number of deaths in each scenario by the ratio change in IFR. Here again we show scenarios for IFR up by 33%, and down by 33%. The changes are less dramatic than when moving R0, but still material. /24
One particularly interesting combination is to have IFR down *and* R0 down – this corresponds roughly to a variant that behaves like the old wildtype, except for the immunity escape. This looks a bit better – we can now absorb a reduction of up to 20% in VE vs. infection. /25
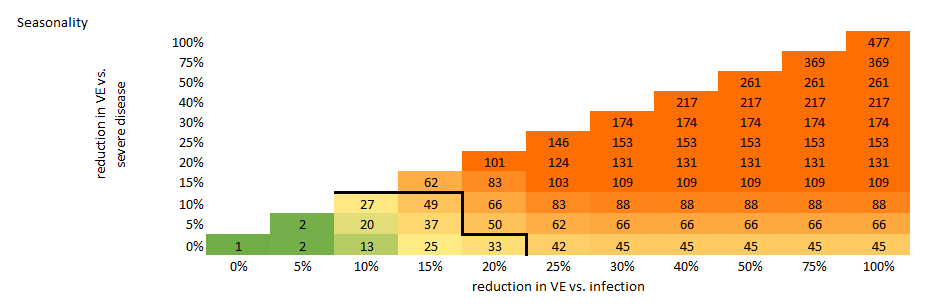
What else could help us here? So far, I’ve been running the model with the seasonality mode switched off. What happens if I turn it on? Well, we gain a bit of leeway, but to be honest not that much – it mostly shifts the problem in time rather than actually resolving it. /26
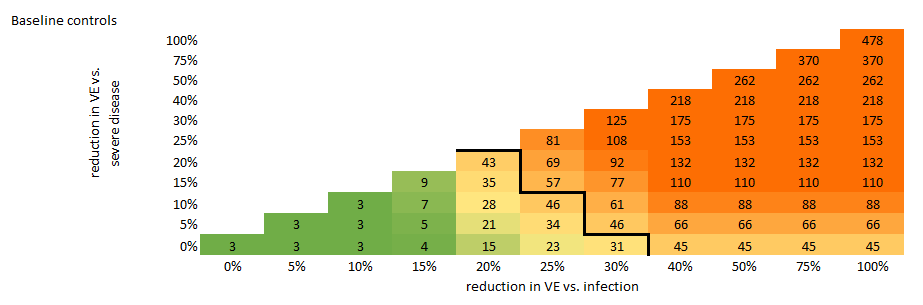
A slightly more helpful change is to maintain baseline controls (e.g. such as TTI, masks etc.) after we unlock in June, until the variant ‘wave’ has completed. This isn’t cost-free, but it would give us flexibility to handle up to a 15% escape in VE vs. infection. /27
And it looks slightly better again if we combine baseline controls with a mild dose of seasonality (which I think is likely) – not a dramatic change, but some helpful reduction in the death figures. /28
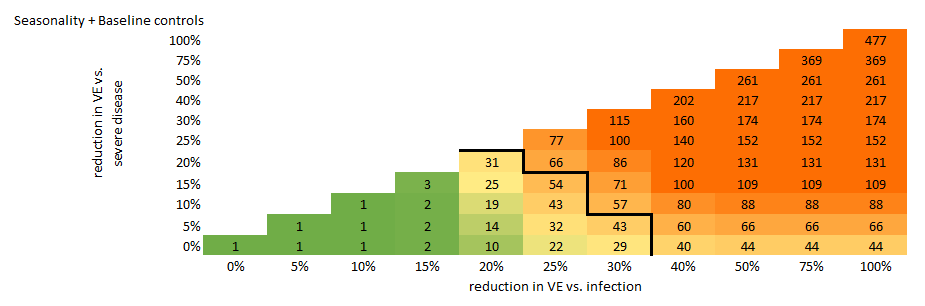
You’re probably bored of looking at triangular tables now, so I’m just going to give you one final one, which is a bit more optimistic. This goes back to our wildtype-like variant, with R0 and IFR reduced, and adds in seasonality and baseline controls: /29
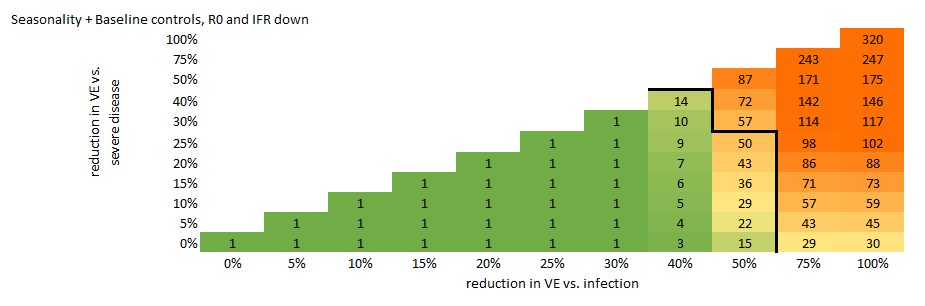
Now that’s better, even a 40% reduction in VE vs. infection looks manageable in this scenario. But we should remember that’s probably our best case here. If the variant looks more like B.1.1.7 in terms of R0 and IFR, then we can afford much less reduction in VE. /30
So, how worried am I after all that? The honest answer is that I’m still not sure: until we get a good handle on how likely a (say) 20% or 40% escape of immunity is, it’s hard to interpret these tables into a good or bad feeling. But given the way that small changes in VE… /31
…can drive large numbers of deaths, I am concerned that we don’t have a lot of room for maneuver. One obvious question is: why is the model this sensitive? And I think the answer is: because at the point of unlocking, we are precariously balanced close to the HI threshold. /32
Even if we have a small exit wave, it won’t take us much beyond HIT – which is good in the short term (fewer deaths and hospital admissions), but then leaves us exposed to new variants that escape even a small slice of immunity. Hence the strong sensitivity. /33
So what is important is that we stay vigilant, and in particular focus on the following four things:
1) Urgently gather more data on the potential level of immunity escape (vs vaccines and prior infection) for B.1.351 & others to refine the threat assessment /34
1) Urgently gather more data on the potential level of immunity escape (vs vaccines and prior infection) for B.1.351 & others to refine the threat assessment /34
2) Continue to test and sequence to track the emergence of VOCs in the UK as we open up
3) Prepare vaccine manufacturing capacity and supply contracts for quick-response boosters to re-vax the vulnerable groups asap if a variant with significant ‘escape’ does emerge /35
3) Prepare vaccine manufacturing capacity and supply contracts for quick-response boosters to re-vax the vulnerable groups asap if a variant with significant ‘escape’ does emerge /35
4) Develop contingency plans to be used if an ‘escape’ variant emerges faster than the vaccine boosters can be delivered, and we need to buy ourselves some time. /36
Overall, I’m still optimistic that we’re on a path to beating this. It’s just that there might still be a few twists and turns on the journey before we can declare final victory. Over & out, and have a great weekend. /end
• • •
Missing some Tweet in this thread? You can try to
force a refresh