Apr 9
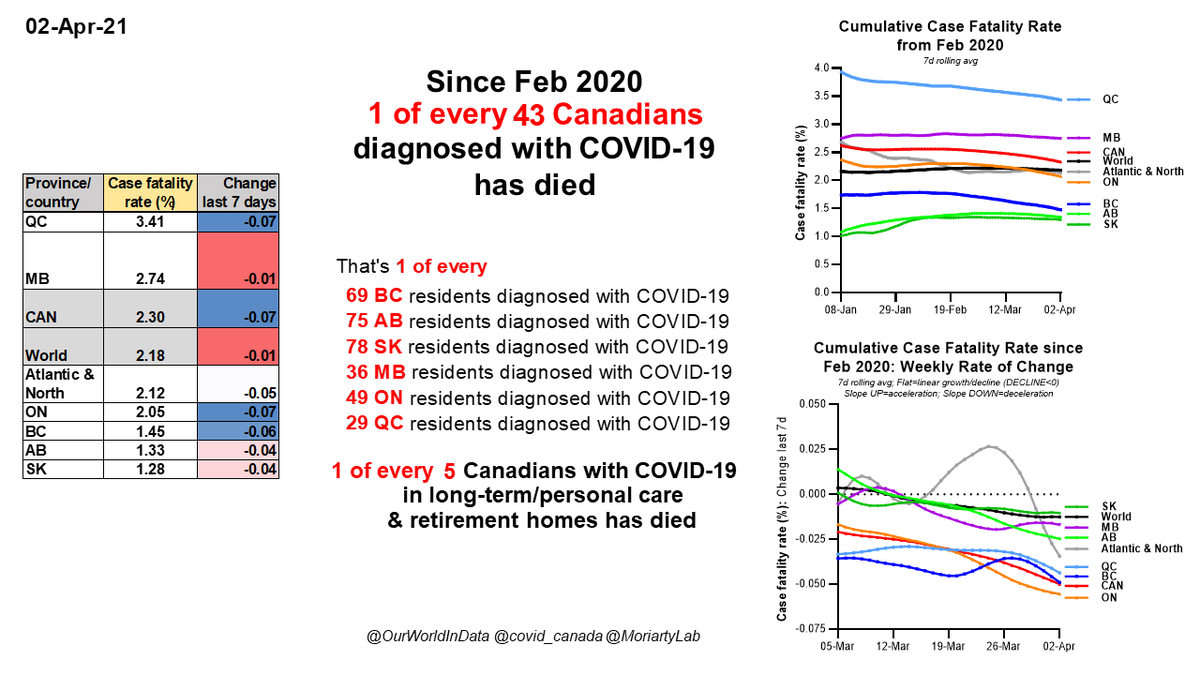
1 of every 45 #Canadians with #COVID19 has died since Feb 2020
1 in 73 BC
1 in 79 AB
1 in 79 SK
1 in 37 MB
1 in 51 ON
1 in 30 QC
1 of every 5 Cdns w/ C19 in long-term care & retirement homes has died
LAST 28 DAYS: 812 deaths, 1,183 LTC/RH cases, 303 LTC/RH deaths
1 of every 45 #Canadians with #COVID19 has died since Feb 2020
1 in 73 BC
1 in 79 AB
1 in 79 SK
1 in 37 MB
1 in 51 ON
1 in 30 QC
1 of every 5 Cdns w/ C19 in long-term care & retirement homes has died
LAST 28 DAYS: 812 deaths, 1,183 LTC/RH cases, 303 LTC/RH deaths

Apr 9
-#COVID19 is in top 4 largest mortality events in #Canadian history
-Last 28 days: 812 Canadians died of C19
-If every week is like this week, 868 Canadians may die in next 28 days
-#COVID19 is in top 4 largest mortality events in #Canadian history
-Last 28 days: 812 Canadians died of C19
-If every week is like this week, 868 Canadians may die in next 28 days

Apr 9
#COVID19 #Canada
CASE FATALITY RATES
Wave 1 (to Aug 17)
Wave 2 (to Feb 18)
Wave 3 (Feb 19 to date)
#COVID19 #Canada
CASE FATALITY RATES
Wave 1 (to Aug 17)
Wave 2 (to Feb 18)
Wave 3 (Feb 19 to date)

Apr 9
Since Feb 2020
For every 1 Atlantic & Northern #Canadian who DIED of #COVID19 this many people died of COVID-19 in other regions*
BC 9X
AB 14X
SK 11X
MB 21X
ON 15X
QC 38X
Rest of #Canada 18X
Rest of World 11X
*after adjusting for population differences
Since Feb 2020
For every 1 Atlantic & Northern #Canadian who DIED of #COVID19 this many people died of COVID-19 in other regions*
BC 9X
AB 14X
SK 11X
MB 21X
ON 15X
QC 38X
Rest of #Canada 18X
Rest of World 11X
*after adjusting for population differences

Apr 9
#COVID19 #Canada DEATHS since Feb 2020
Table: Deaths/100K & change last 7 days for provinces, Canada, rest of world
Graphs
-Total deaths (mid top)
-Total deaths per 100K (mid bottom)
-Wkly rate of change in deaths (bottom right)
#COVID19 #Canada DEATHS since Feb 2020
Table: Deaths/100K & change last 7 days for provinces, Canada, rest of world
Graphs
-Total deaths (mid top)
-Total deaths per 100K (mid bottom)
-Wkly rate of change in deaths (bottom right)


Apr 9
1 of every 5 #Canadians with #COVID19 in long-term/ personal care & retirement homes has died since Feb 2020
1 in 5 BC
1 in 7 AB
1 in 5 SK
1 in 4 MB
1 in 8 ON
1 in 4 QC
There are 1,183 LTC/RH cases in last 28 days
1 of every 5 #Canadians with #COVID19 in long-term/ personal care & retirement homes has died since Feb 2020
1 in 5 BC
1 in 7 AB
1 in 5 SK
1 in 4 MB
1 in 8 ON
1 in 4 QC
There are 1,183 LTC/RH cases in last 28 days

Apr 9
#COVID19 #Canada
Long-term care/retirement home CASE FATALITY RATES
Wave 1 (to Aug 17)
Wave 2 (to Feb 18)
Wave 3 (Feb 19 to date)
Note: some of deaths reported in W3 may have happened in W2 due to slow reporting in this sector.
#COVID19 #Canada
Long-term care/retirement home CASE FATALITY RATES
Wave 1 (to Aug 17)
Wave 2 (to Feb 18)
Wave 3 (Feb 19 to date)
Note: some of deaths reported in W3 may have happened in W2 due to slow reporting in this sector.

Apr 9
Since Feb 2020
For every 1 Atlantic and Northern #Canadian in long-term care & retirement homes who DIED of #COVID19, this many people in LTC/RHs died of C19 in other regions*
BC 8X
AB 13X
SK 5X
MB 17X
ON 14X
QC 41X
#Canada 18X
*adjusted for population differences
Since Feb 2020
For every 1 Atlantic and Northern #Canadian in long-term care & retirement homes who DIED of #COVID19, this many people in LTC/RHs died of C19 in other regions*
BC 8X
AB 13X
SK 5X
MB 17X
ON 14X
QC 41X
#Canada 18X
*adjusted for population differences

Apr 9
#COVID19 #Canada long-term care & retirement home DEATHS since Feb 2020
Tables: Per capita deaths + change last 7 days, % total deaths in LTC/RH
Graphs:
-Total & per capita values (L)
-% total deaths in LTC/RH (R top)
#COVID19 #Canada long-term care & retirement home DEATHS since Feb 2020
Tables: Per capita deaths + change last 7 days, % total deaths in LTC/RH
Graphs:
-Total & per capita values (L)
-% total deaths in LTC/RH (R top)

Apr 9
#COVID19 #Canada
Long-term care/retirement homes
-DEATHS/100K
-% TOTAL DEATHS IN LTC/RH
Wave 1 (to Aug 17)
Wave 2 (to Feb 18)
Wave 3 (Feb 19 to date)
#COVID19 #Canada
Long-term care/retirement homes
-DEATHS/100K
-% TOTAL DEATHS IN LTC/RH
Wave 1 (to Aug 17)
Wave 2 (to Feb 18)
Wave 3 (Feb 19 to date)

Apr 9
Since Feb 2020
For every 1 Atlantic & Northern #Canadian DIAGNOSED with #COVID19 this many people were diagnosed with COVID-19 in other regions*
BC 14X
AB 23X
SK 19X
MB 16X
ON 17X
QC 24X
Rest of #Canada 17X
Rest of World 11X
*after adjusting for population differences
Since Feb 2020
For every 1 Atlantic & Northern #Canadian DIAGNOSED with #COVID19 this many people were diagnosed with COVID-19 in other regions*
BC 14X
AB 23X
SK 19X
MB 16X
ON 17X
QC 24X
Rest of #Canada 17X
Rest of World 11X
*after adjusting for population differences

Apr 9
#COVID19 #Canada CASES since Feb 2020
Table: Cases/100K & change last 7 days for provinces, Canada, rest of world
Graphs
-Total cases (mid top)
-Total cases per 100K (mid bottom)
-Wkly rate of change in cases (bottom right)
#COVID19 #Canada CASES since Feb 2020
Table: Cases/100K & change last 7 days for provinces, Canada, rest of world
Graphs
-Total cases (mid top)
-Total cases per 100K (mid bottom)
-Wkly rate of change in cases (bottom right)


Apr 9
Since Feb 2020
For every 1 Atlantic & Northern #Canadian in long-term care & retirement homes DIAGNOSED with #COVID19, this many people in LTC/RHs were DIAGNOSED in other regions*
BC 6X
AB 11X
SK 3X
MB 9X
ON 13X
QC 19X
#Canada 12X
*adjusted for population differences
Since Feb 2020
For every 1 Atlantic & Northern #Canadian in long-term care & retirement homes DIAGNOSED with #COVID19, this many people in LTC/RHs were DIAGNOSED in other regions*
BC 6X
AB 11X
SK 3X
MB 9X
ON 13X
QC 19X
#Canada 12X
*adjusted for population differences

Apr 9
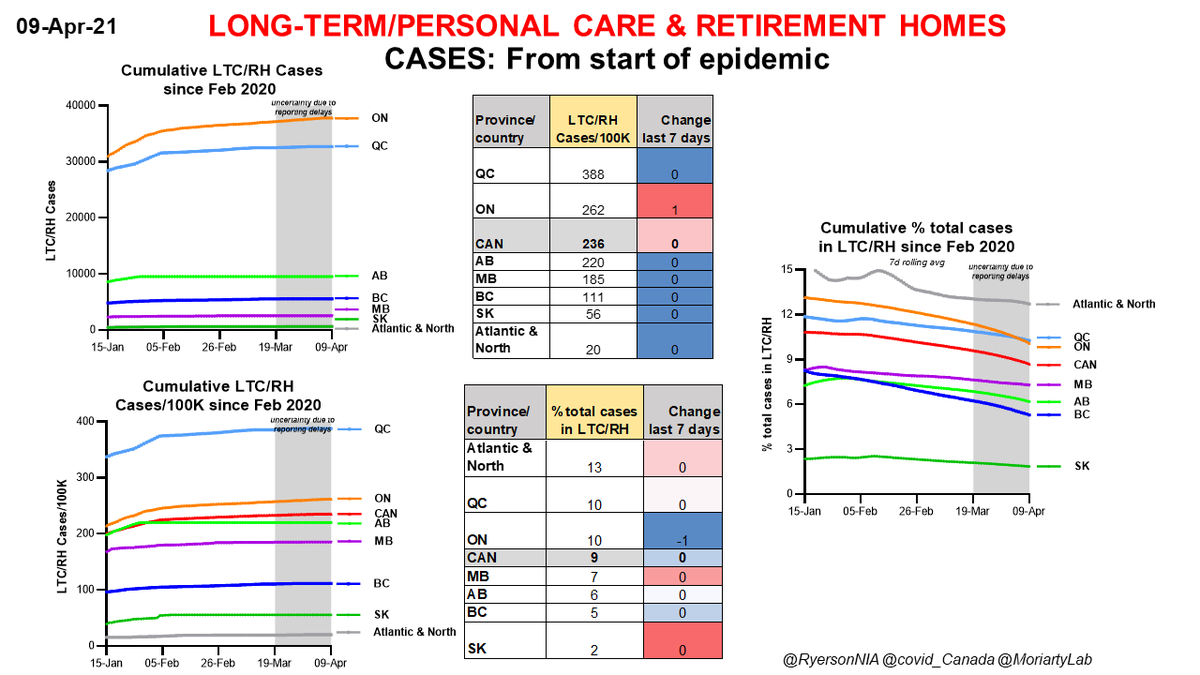
#COVID19 #Canada long-term care & retirement home CASES since Feb 2020
Tables: Per capita cases + change last 7 days, % total cases in LTC/RH
Graphs:
-Total & per capita values (L)
-% total cases in LTC/RH (R top)
#COVID19 #Canada long-term care & retirement home CASES since Feb 2020
Tables: Per capita cases + change last 7 days, % total cases in LTC/RH
Graphs:
-Total & per capita values (L)
-% total cases in LTC/RH (R top)
Apr 9
#COVID19 #Canada
Long-term care/retirement homes
-CASES/100K
-% TOTAL CASES IN LTC/RH
Wave 1 (to Aug 17)
Wave 2 (to Feb 18)
Wave 3 (Feb 19 to date)
#COVID19 #Canada
Long-term care/retirement homes
-CASES/100K
-% TOTAL CASES IN LTC/RH
Wave 1 (to Aug 17)
Wave 2 (to Feb 18)
Wave 3 (Feb 19 to date)

Apr 9
WHAT TO WATCH FOR:
-Weekly rate of change in CASES
WHY?
This shows:
1) if our efforts over the last month are helping
2) when there are warning signs that epidemic may be speeding up again.
WHAT TO WATCH FOR:
-Weekly rate of change in CASES
WHY?
This shows:
1) if our efforts over the last month are helping
2) when there are warning signs that epidemic may be speeding up again.

Apr 9
WHAT TO WATCH FOR:
-Weekly rate of change in HOSPITALIZATIONS
WHY?
This shows:
1) if our efforts over the last month are helping
2) when there are warning signs that hospitalizations may be speeding up again.
WHAT TO WATCH FOR:
-Weekly rate of change in HOSPITALIZATIONS
WHY?
This shows:
1) if our efforts over the last month are helping
2) when there are warning signs that hospitalizations may be speeding up again.

Apr 9
WHAT TO WATCH FOR:
-Weekly rate of change in DEATHS
WHY?
Shows:
1) if efforts ONE MONTH AGO helped
2) warning clues if deaths may be speeding up
ALSO: Rates of change in deaths help us estimate effects of measures such as vaccination in LTC/RHs, where reporting is slow
WHAT TO WATCH FOR:
-Weekly rate of change in DEATHS
WHY?
Shows:
1) if efforts ONE MONTH AGO helped
2) warning clues if deaths may be speeding up
ALSO: Rates of change in deaths help us estimate effects of measures such as vaccination in LTC/RHs, where reporting is slow

Sources of collated official data (in addition to @StatsCan_eng & provincial sites), with huge thanks:
@NoLore
@RyersonNIA
@CU_IIJ
@covid_canada
@OurWorldInData
Thank you to everyone protecting themselves & others by choosing vaccination.
/end
@NoLore
@RyersonNIA
@CU_IIJ
@covid_canada
@OurWorldInData
Thank you to everyone protecting themselves & others by choosing vaccination.
/end

• • •
Missing some Tweet in this thread? You can try to
force a refresh