On Sunday night I posted an analysis of excess deaths in #Canada since start of #COVID19 deaths.
The results were concerning, but interpretation was complicated by parallel toxic drug death epidemic.
I have now corrected for toxic drug deaths.
The results are still concerning.
The results were concerning, but interpretation was complicated by parallel toxic drug death epidemic.
I have now corrected for toxic drug deaths.
The results are still concerning.
Methods:
1. Took weekly excess deaths data from StatsCan (www150.statcan.gc.ca/t1/tbl1/en/tv.…).
2. Added excess deaths for each province/region starting first week when 1 death/million people reported to Nov 15 (last week when we have fairly complete Canadian excess death data): CUMULATIVE
1. Took weekly excess deaths data from StatsCan (www150.statcan.gc.ca/t1/tbl1/en/tv.…).
2. Added excess deaths for each province/region starting first week when 1 death/million people reported to Nov 15 (last week when we have fairly complete Canadian excess death data): CUMULATIVE
For those who don't know, "excess death" is the number of deaths MORE than what you'd expect in any given period. More than all the normal deaths that occur in the population yearly.
Here's how excess death is calculated...
Here's how excess death is calculated...
You take the average number of deaths that have occurred in a specific week over the previous 5 years. To calculate the excess death THIS year, you take the deaths that occurred in that week this year, and subtract the average from the previous 5 years.
Sometimes this number is negative. Sometimes it's positive. However, if you add up the excess deaths for many weeks in a row and you a consistent and growing increase over baseline, this means there's likely something unusual going on that's causing more death in the population.
Since the toxic drug crisis and COVID-19 are parallel epidemics in Canada, both causing many deaths, if we want to understand excess deaths related to direct and indirect effects of COVID-19, then it helps to estimate how much excess death is due to toxic drugs.
I've done this using data for the last 4 years reported by Health Canada here: health-infobase.canada.ca/substance-rela…
I calculated avg toxic drug deaths by province, sex, age from 2016-2019, and subtracted this number from toxic drug deaths for 2020 to estimate 2020 excess drug deaths.
I calculated avg toxic drug deaths by province, sex, age from 2016-2019, and subtracted this number from toxic drug deaths for 2020 to estimate 2020 excess drug deaths.
I'll add my spreadsheet at the end of the thread so you can check specific numbers and calculations. Manitoba hasn't reported toxic drug death data yet for 2020. And we have data for Jan-June for other provinces, so I had to assume a similar death rate out to Nov 14.
After obtaining the estimated of excess deaths in 2020 due to toxic drugs, I calculated how many excess toxic drug deaths occurred per week, and SUBTRACTED this number for each province, age group, sex from StatsCan weekly excess death data (total excess deaths).
These are estimates of the amount of excess death that was NOT due to toxic drugs. The majority of these deaths occur in people 20-49, and the majority of C19 deaths occur in people older than this age group, so it's not unreasonable to separate the excess deaths this way.
Here are the results. I'll be using much of the same tweet text I used on Sunday night, so if you've read some of it before, bear with me.
All data I'm showing from here on out are corrected for excess deaths due to toxic drugs.
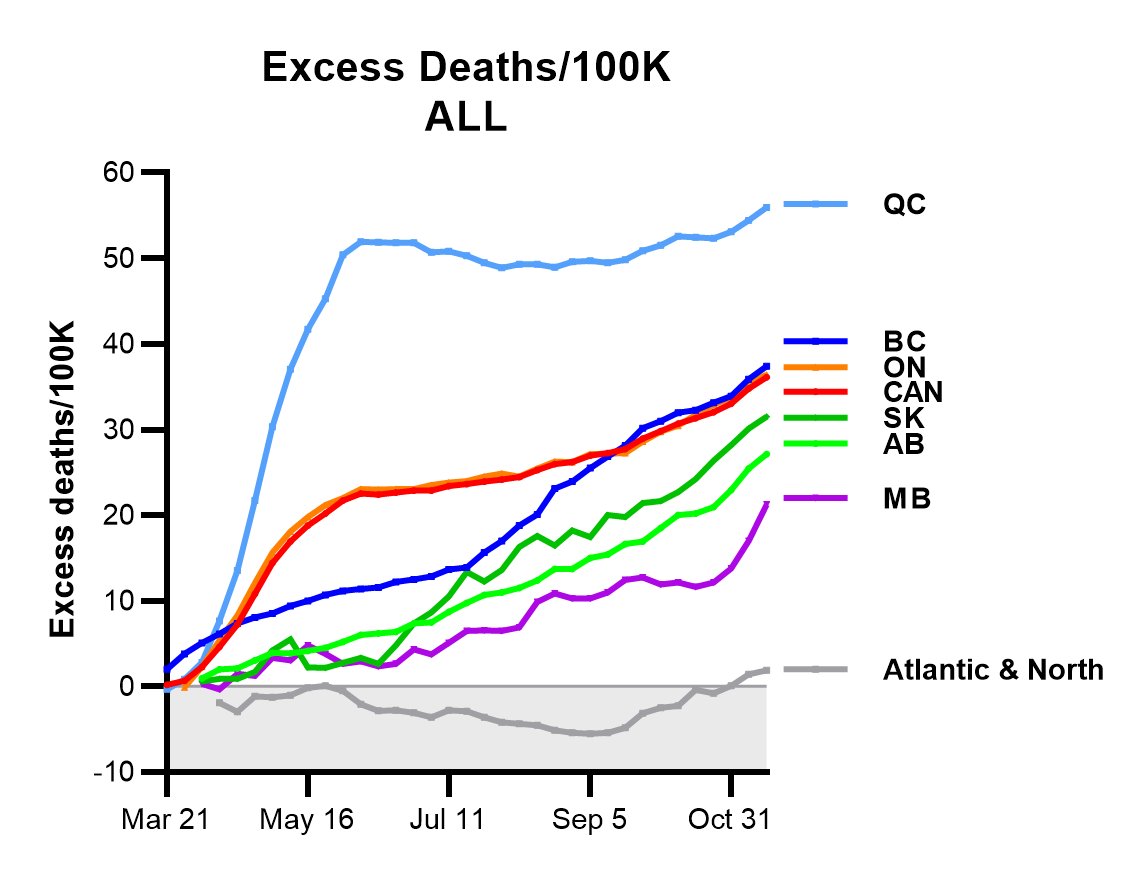
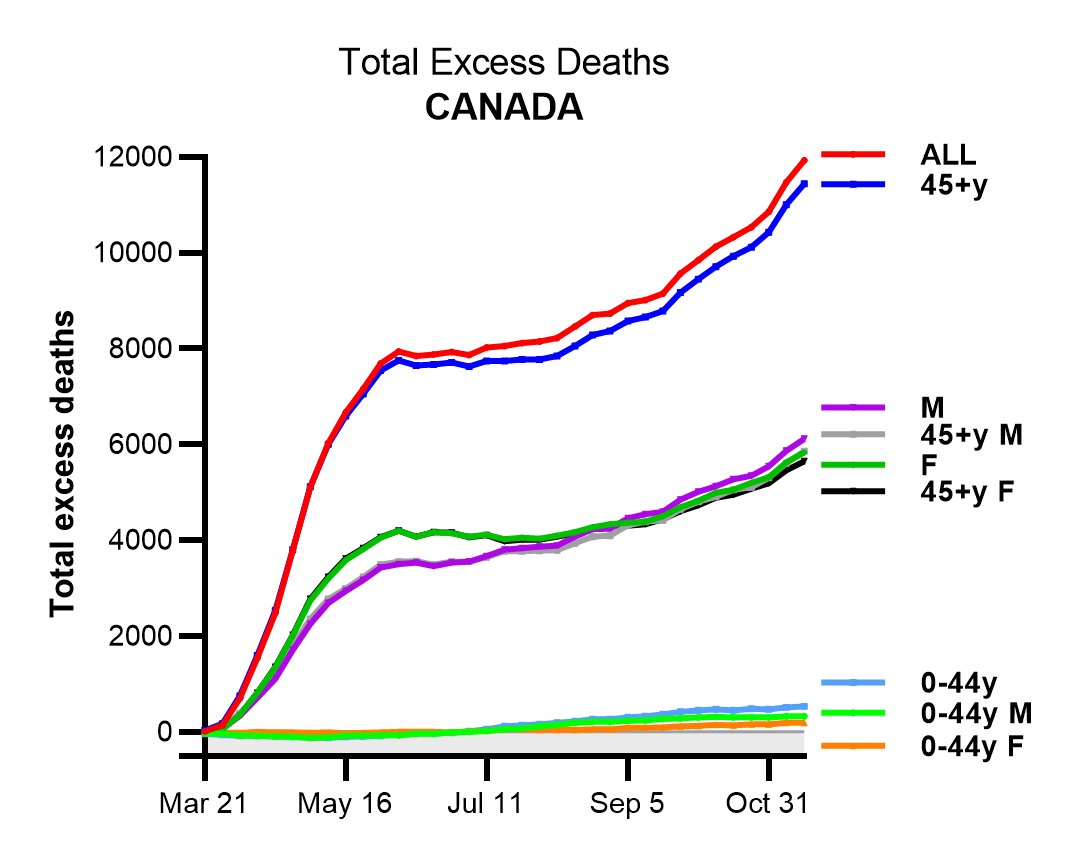
First, I'll start with plots of cumulative excess deaths in Canada until Nov 14 (the last date when we have fairly complete excess death reporting for most of Canada).
I've set the start date as the first week when a province or territory reached 1 reported C19 death/million pop
I've set the start date as the first week when a province or territory reached 1 reported C19 death/million pop

Here are the excess deaths/100K, for those interested.
Most of Canada's excess deaths during #COVID19 epidemic have been in people older than 44.
Excess deaths in 0-44 group might be C19-related, but are more likely due to parallel opioid death epidemic, since most opioid deaths happen in people 20-49.
Suicide has NOT increased.
Excess deaths in 0-44 group might be C19-related, but are more likely due to parallel opioid death epidemic, since most opioid deaths happen in people 20-49.
Suicide has NOT increased.
Following are a series of graphs of excess deaths broken down by age and sex for different regions and provinces.
They're very interesting in their own right, and I know people will want to see them.
They're very interesting in their own right, and I know people will want to see them.
Atlantic provinces and Northern territories: Excess deaths, by age and sex
Pooled data are presented for Atlantic provinces and Northern territories, where #COVID19 epidemic has been well-controlled
This assists comparison to other regions with more poorly controlled epidemics
Pooled data are presented for Atlantic provinces and Northern territories, where #COVID19 epidemic has been well-controlled
This assists comparison to other regions with more poorly controlled epidemics

Quebec: Excess deaths, by age and sex

Ontario: Excess deaths, by age and sex

Manitoba: Excess deaths, by age and sex

Saskatchewan: Excess deaths, by age and sex

Alberta: Excess deaths, by age and sex

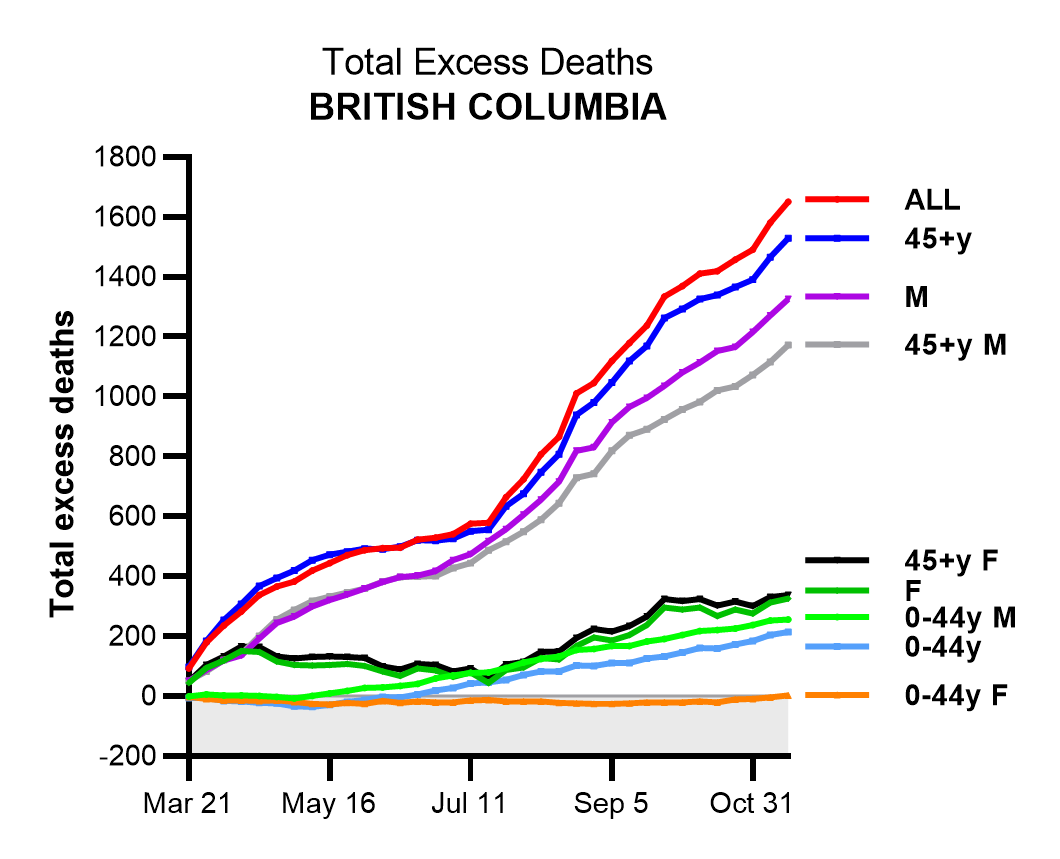
British Columbia: Excess deaths, by age and sex
Here are side by side comparisons of total reported #COVID19 deaths for the same period (left) and total excess deaths in people 45 years and older (right).
Some provinces look quite different in these two graphs, even after correct for excess toxic drug deaths.
Some provinces look quite different in these two graphs, even after correct for excess toxic drug deaths.


In the following tweets, I'll compare reported #COVID19 deaths to excess deaths in people 45 years and older.
First, Atlantic and Northern Canada
Excess deaths were less than reported #COVID19 deaths.
Excess deaths are deaths on top of what we expect normally. Some frail, sick ppl who got C19 might have died anyway, so it's expected that excess would be lower than reported C19 death.
Excess deaths were less than reported #COVID19 deaths.
Excess deaths are deaths on top of what we expect normally. Some frail, sick ppl who got C19 might have died anyway, so it's expected that excess would be lower than reported C19 death.

In Quebec we see a similar pattern, but on a large scale. Reported #COVID19 deaths are greater than excess deaths.
It's likely this is partly because of how many C19 deaths occurred in QC nursing homes, more than any other province or region.
It's likely this is partly because of how many C19 deaths occurred in QC nursing homes, more than any other province or region.

In Manitoba, excess deaths in people 45 years and older were close to reported #COVID19 deaths.
Recall: deaths for MB are NOT corrected for toxic drug deaths, so excess deaths in younger people are higher than QC, Atlantic/North.
Recall: deaths for MB are NOT corrected for toxic drug deaths, so excess deaths in younger people are higher than QC, Atlantic/North.

Ontario
Unlike in Atlantic and Northern Canada, QC and MB, excess deaths in people 45 years and older are about one third higher than reported #COVID19 deaths.
Why? Has ON missed 25-30% of C19 deaths, or does the province report differently than the regions above?
Unlike in Atlantic and Northern Canada, QC and MB, excess deaths in people 45 years and older are about one third higher than reported #COVID19 deaths.
Why? Has ON missed 25-30% of C19 deaths, or does the province report differently than the regions above?

Saskatchewan
Excess deaths in people 45 years and older were 9X higher than reported #COVID19 deaths.
Why?
Excess deaths in people 45 years and older were 9X higher than reported #COVID19 deaths.
Why?

Alberta
Excess deaths in people 45+ were close till early September, but as reported C19 deaths started spiking excess deaths spiked too--nearly 2X as high as reported deaths by Nov 14.
ON has similar profile: biggest divergence happened during fastest C19 death increases.
Excess deaths in people 45+ were close till early September, but as reported C19 deaths started spiking excess deaths spiked too--nearly 2X as high as reported deaths by Nov 14.
ON has similar profile: biggest divergence happened during fastest C19 death increases.

Finally, British Columbia.
There was a lot of push-back about this graph on Sunday, but the graph here is corrected for toxic drug deaths.
Excess deaths in people 45 and older are 5X higher than reported #COVID19 deaths. And they've been higher since the epidemic start.
??????
There was a lot of push-back about this graph on Sunday, but the graph here is corrected for toxic drug deaths.
Excess deaths in people 45 and older are 5X higher than reported #COVID19 deaths. And they've been higher since the epidemic start.
??????

In closing, here are side-by-side graphical comparisons of provinces showing:
1. Excess deaths in people 45 and older/100K people
2. Reported #COVID19 deaths/100K people
They tell two quite different stories of the impact of the epidemic up to November 15.
Comments welcome.
1. Excess deaths in people 45 and older/100K people
2. Reported #COVID19 deaths/100K people
They tell two quite different stories of the impact of the epidemic up to November 15.
Comments welcome.


Whoops. Sorry. posted wrong graph here. This one is excess vs reported C19 for QC.
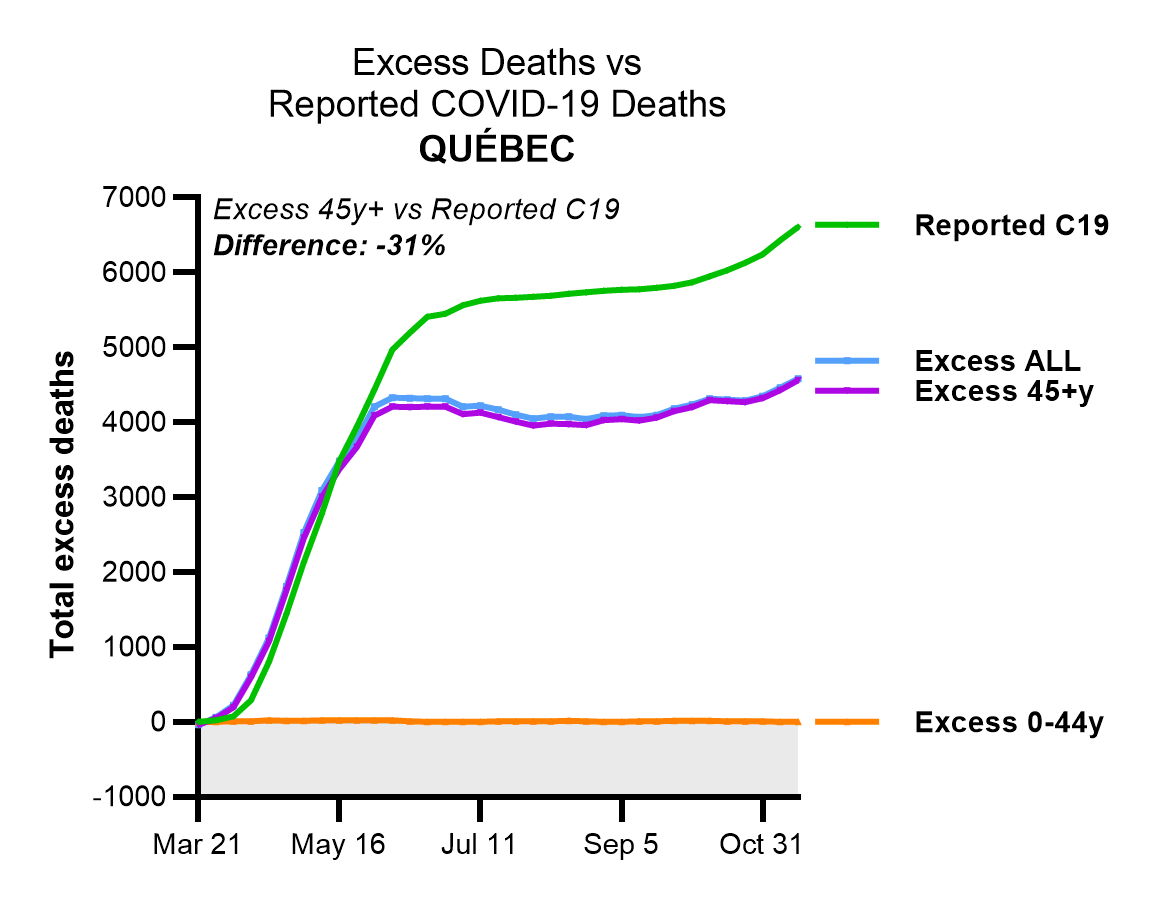
And I uploaded the wrong image for the reported C19 vs excess deaths graph for QC. Here's the correct graph.

Adding some thoughts about reasons for differences between excess deaths and reported #COVID19 deaths.
First, I don't think it's intentional under-reporting, although I do want to know which provinces report probable C19 deaths and which only report lab-confirmed.
First, I don't think it's intentional under-reporting, although I do want to know which provinces report probable C19 deaths and which only report lab-confirmed.
WHO recommends that countries report both probable and lab-confirmed. This is because testing has been pretty limited in many places, including Canada. We're chronically under-testing in much of Canada, and focus on symptomatic people, so we miss many cases.
In Canada, if someone hasn't been tested or isn't tested post-mortem they only qualify as a problem C19 case/death if they have clinical symptoms compatible with C19 AND are epi-linked to a known case or outbreak setting.
Remember, C19 deaths can occur from cardio/cerebrovascular events. If someone dies suddenly of a stroke or heart attack in a region where people think there isn't C19, or not much of it, C19 testing might not be conducted or even considered.
I suspect this is part of why excess death to reported C19 death ratio is higher in provinces that thought they had low case numbers through first wave, summer and early fall. In ON, this would include many regions outside the GTA and Ottawa who thought it was a big city problem.
I've been living 5 h north of Toronto for the last year. Getting C19 tests to see my mom in her retirement home has been slow. It often takes nearly a week (or more) to get results back. I know my tests are lower priority because I'm healthy, but this turnaround time isn't good.
What do you want to bet that this situation is common outside major urban centres with large C19 caseloads, especially those fairly far from high case number areas?
Or in provinces w/ large agricultural operations & work camps w/ congregate living & crowded work conditions?
Or in provinces w/ large agricultural operations & work camps w/ congregate living & crowded work conditions?
These are the cases and deaths I would suspect might be missed. The ones that end up in a community or worksite clinic but maybe not in hospital.
Or sudden in-home deaths of older people that aren't recognized as C19. Remember, many older people are asymptomatic/present atypically. This is partly why C19 spread so fast in LTC.
If C19 cases were hard to detect in LTC without testing due to atypical/lack of symptoms, imagine how often cases go undetected in community-dwelling seniors living alone or with family.
@LauraCRosella and colleagues did an excess death study using cremation data from ON during the first wave, and found there was significantly greater excess death among community-dwelling older adults than expected based on data for diagnosed C19 deaths.
I strongly suspect we've been missing community C19 deaths, likely among people whose deaths might not have "looked" like C19 as we know it in younger people and who were thought to die of some other underlying condition.
Anyway, all of this is speculation, but I think we need to be watching community deaths very, very closely as we're entering third wave in some parts of Canada, especially with more transmissible and deadly strains.
When in doubt, test.
When in doubt, test.
• • •
Missing some Tweet in this thread? You can try to
force a refresh