Thread on Canadian excess deaths during #COVID19, round 3.
Why do I keep posting about this?
Because I'm worried we've missed a lot of C19 deaths outside LTC and that we may see many more during the 3rd wave because of slow rollout of vaccination of older adults in community.
Why do I keep posting about this?
Because I'm worried we've missed a lot of C19 deaths outside LTC and that we may see many more during the 3rd wave because of slow rollout of vaccination of older adults in community.
When did I start thinking about this?
Last year, after reading a paper from @LauraCRosella & colleagues about excess mortality during first wave in Ontario, estimated from cremation data (which is reported fast and includes place of death information).
medrxiv.org/content/10.110…
Last year, after reading a paper from @LauraCRosella & colleagues about excess mortality during first wave in Ontario, estimated from cremation data (which is reported fast and includes place of death information).
medrxiv.org/content/10.110…
Actually, it dates back further, to a @CIHI_ICIS report on #COVID19 deaths in congregate care in #Canada, which found that 80% of deaths in the first wave were in congregate care (long-term care, retirement homes), which in turn is twice the OECD average.
cihi.ca/sites/default/…
cihi.ca/sites/default/…
BTW the percentage of Canada's C19 deaths that have occurred in congregate care has barely budged since the first wave. It was 80% then. It's 74% as of March 19.
https://twitter.com/MoriartyLab/status/1373455335709626378?s=20
The only province close to the OECD Wave 1 average for % total deaths in congregate care is Saskatchewan, but as you'll see later in this thread, SK data may not be very complete (although SK does have fewer chain LTC facilities than many other provinces).
Of course, it's possible that Canada has been abysmal at preventing C19 deaths in congregate care, which is undeniably true.
But, there's another possibility, which is that we've missed many C19 deaths outside congregate care, driving % deaths in this setting higher.
But, there's another possibility, which is that we've missed many C19 deaths outside congregate care, driving % deaths in this setting higher.
I accepted that we were twice as bad at protecting Canadians in congregate care from C19 as other OECD countries. But then we started seeing the results of national seroprevalence studies conducted by @CanadasLifeline.
You can find the results here: covid19immunitytaskforce.ca/canadian-serop…
You can find the results here: covid19immunitytaskforce.ca/canadian-serop…
Seroprevalence studies report on what percentage of people have antibodies to the virus that causes C19 in their blood. There are limitations, such as that antibody levels go down over time (under-estimating how many people have been infected).
Also, blood donors are more likely to be people with higher socioeconomic status who have more time to donate blood. Higher SES people have experienced much lower rates of C19, so for this reason seroprevalence data are likely underestimates of how many people have been infected.
Using seroprevalence data, I started estimating how many cases and deaths we should have detected.
Here's an example for ON. By June seroprevalence was 1.2%. This means we'd had (at least) 174,000 cases by Jun 30. But by Jun 30, ON had detected 36,842, or about 20% of cases.
Here's an example for ON. By June seroprevalence was 1.2%. This means we'd had (at least) 174,000 cases by Jun 30. But by Jun 30, ON had detected 36,842, or about 20% of cases.
ON's case fatality rate by June 30 was 7.4%. Based on that number, we would have expected nearly 13,000 C19 deaths by Jun 30. But that CFR is very high, suggesting that many of cases we did detect were among the most vulnerable, such as congregate care.
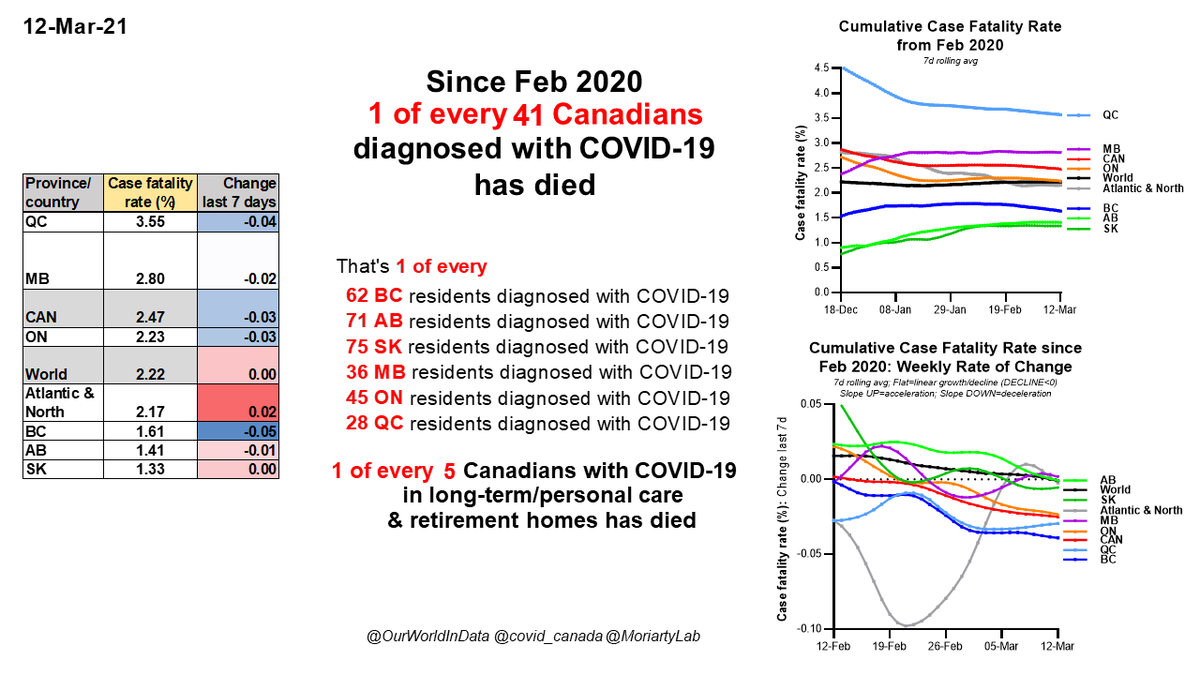
As of Mar 19, Ontario's cumulative case fatality rate is 2.2%, which is within the SARS-Cov2 infection fatality rate range reported in other countries (and incidentally is nearly exactly the same as the current CFR for the world to date).
With at least 174,000 cases and a CFR of 2.2%, you'd expect over 3,800 C19 deaths by June 30, but 2,720 were reported, a difference of about 40%.
Here's where excess death estimates come in.
Sorry. This is a long thread because I didn't plan it before I started!
Here's where excess death estimates come in.
Sorry. This is a long thread because I didn't plan it before I started!
The first estimate of ON excess mortality was from @LauraCRosella et al (cremation study). I've put data from their paper in the table below.
They estimated 4,100 excess deaths in ON from Mar-Jun 30. Very close to expected number of C19 deaths based on seroprevalence data.
They estimated 4,100 excess deaths in ON from Mar-Jun 30. Very close to expected number of C19 deaths based on seroprevalence data.

Excess mortality estimates from @StatCan_eng for ON from mid-March to end of June give a similar number, 3,330, although ON reporting for total deaths in this period is not yet complete.
Now, the toxic drug epidemic has caused a lot of deaths in Canada this year, in parallel with the C19 epidemic. Excess deaths include all deaths that are greater than expected based on previous years. So you have to separate these two epidemics.
I posted last week about how I estimated the excess deaths in 2020 that were due to toxic drugs.
https://twitter.com/MoriartyLab/status/1372009067766542338?s=20
Basically, I estimated weekly excess toxic drug deaths in 2020, and subtracted this from weekly total excess deaths reported by @StatCan_eng. I won't rehash the method here.
Last week's thread showed that there were a LOT of excess deaths unexplainable by toxic drug deaths in multiple provinces, especially ON, SK, AB and BC.
But I'd broken the analysis down into 2 age groups, people younger and older than 45.
But I'd broken the analysis down into 2 age groups, people younger and older than 45.
This week I've added a 65+ group, where excess deaths are much, much less likely to be due to toxic drugs (even though all the data I'm showing are adjusted for drug deaths).
And I've added predicted deaths from seroprevalence data.
And I've added predicted deaths from seroprevalence data.
Last week, a neurologist in SK was pretty certain that C19 deaths could have been missed in SK, because they would have shown up in hospitals.
However, I want everyone to remember something really crucial (and chilling) from the @LauraCRosella et al cremation study.
However, I want everyone to remember something really crucial (and chilling) from the @LauraCRosella et al cremation study.
The cremation data they analyzed includes location of death information, so they were able to identify how many excess deaths in ON occurred in hospitals, LTC, people's homes (residence) and other.
Many people believe that hospitals are epicentre of Cdn C19 deaths. But they're not, or they weren't up to June 30 in ON, where:
--<0% of excess deaths occurred in hospital
--one third of excess deaths occurred in LTC
--TWO THIRDS OF EXCESS DEATHS OCCURRED IN RESIDENCES (table).
--<0% of excess deaths occurred in hospital
--one third of excess deaths occurred in LTC
--TWO THIRDS OF EXCESS DEATHS OCCURRED IN RESIDENCES (table).

You're probably beginning to see why I'm so worried about the third wave.
We're operating under the assumption that almost all our deaths occurred in congregate care, but it sure looks like nearly twice as many deaths occurred in community.
We're operating under the assumption that almost all our deaths occurred in congregate care, but it sure looks like nearly twice as many deaths occurred in community.
It's not quite this simple (it never is), and there are competing explanations. For example, people might have died of other causes such as cancer (although this is more likely to have occurred in hospital). Or they might have stayed away from hospital and died of heart attacks.
The staying away from hospital hypothesis has legs, but if this is the only explanation, you would have expected a lot fewer excess deaths from July to Nov in most provinces, before we hit the full height of Wave 2. But this wasn't true, as I'll show below.
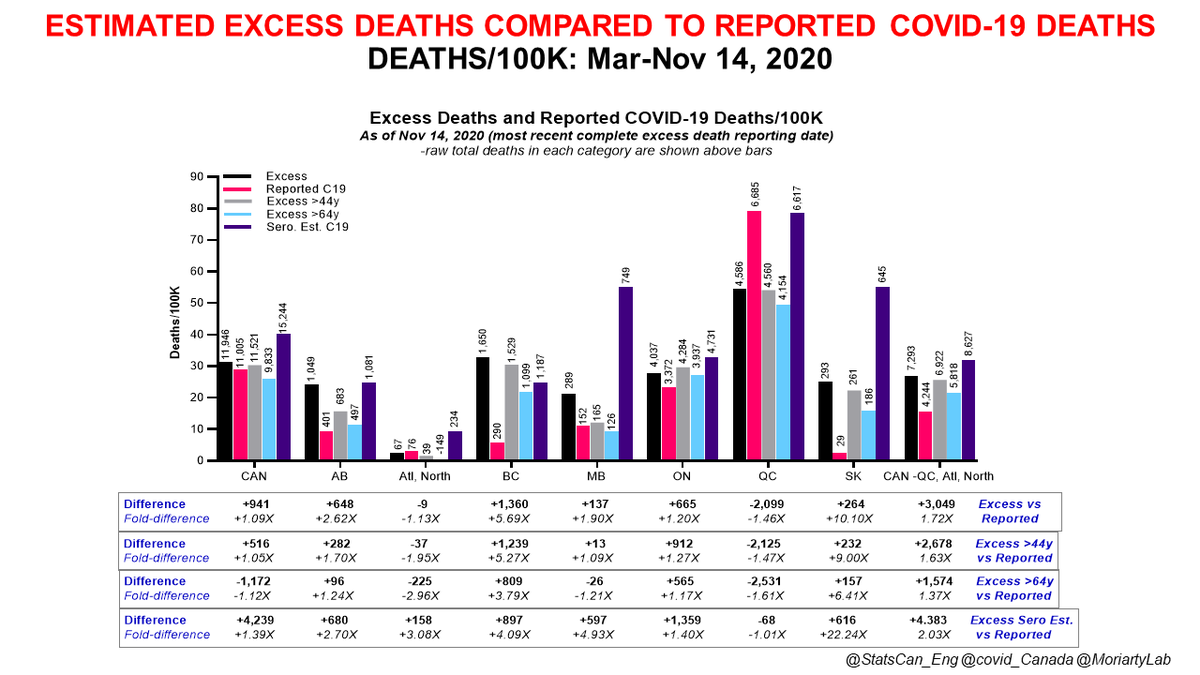
Here is a complex graph showing total excess deaths (black), reported C19 deaths (red), excess deaths in people 45 and older (gray), excess deaths in people 65 and older (light blue), plus predicted C19 deaths based on seroprevalence & CFR in each province Mar 19 (dark blue).

This shows deaths in each category/100K people, but the raw death numbers are shown above each column. Remember, all excess death numbers have been adjusted for excess deaths due to toxic drugs.

These are the cumulative deaths from mid-March to Nov 14 BTW.
Underneath the graph I show the DIFFERENCE between excess/predicted deaths in different categories and the REPORTED C19 deaths in the same category, as well as the fold-difference between excess/predicted & reported.
Underneath the graph I show the DIFFERENCE between excess/predicted deaths in different categories and the REPORTED C19 deaths in the same category, as well as the fold-difference between excess/predicted & reported.
There are 4 categories of comparison to the Reported C19 deaths group:
1. Excess deaths, all ages
2. Excess deaths, people 45 years and older
3. Excess deaths, people 65 years and older
4. Predicted C19 deaths based on seroprevalence data for each province
1. Excess deaths, all ages
2. Excess deaths, people 45 years and older
3. Excess deaths, people 65 years and older
4. Predicted C19 deaths based on seroprevalence data for each province

In the panel shown here, you can see reported C19 deaths over time (top left) and
1. excess deaths, all ages (top R)
2. excess deaths, 45+y (bottom L)
3. excess deaths, 65+y (bottom R)
We don't have time series data for seroprevalence-estimated deaths.
1. excess deaths, all ages (top R)
2. excess deaths, 45+y (bottom L)
3. excess deaths, 65+y (bottom R)
We don't have time series data for seroprevalence-estimated deaths.

When you compare these graphs to each other, you can see that the patterns look fairly similar for all the excess death graphs, meaning that deaths in the 45+ and 65+ categories determine the overall curve, as would be expected if excess deaths were primarily due to C19.

Also, note that the big first spike in excess deaths coincides with the first C19 wave, then dips a bit over the summer as deaths declined, then excess deaths pick up more toward the end of summer.

Finally, note that inter-provincial differences in the reported C19 panel (top L) look quite different than inter-provincial differences in the excess death panels.

OK. Let's look at each region/province.
In the following tweets, excess deaths/100K are plotted for different age groups and sexes (left), and compared to reported C19 deaths (right).
In the following tweets, excess deaths/100K are plotted for different age groups and sexes (left), and compared to reported C19 deaths (right).
Starting with Atlantic and Northern Canada, where there the impact of the C19 epidemic has been well-managed by keeping cases low.
This is the negative control. This is what excess deaths would likely look like when you have restrictions in place and low case numbers.
This is the negative control. This is what excess deaths would likely look like when you have restrictions in place and low case numbers.
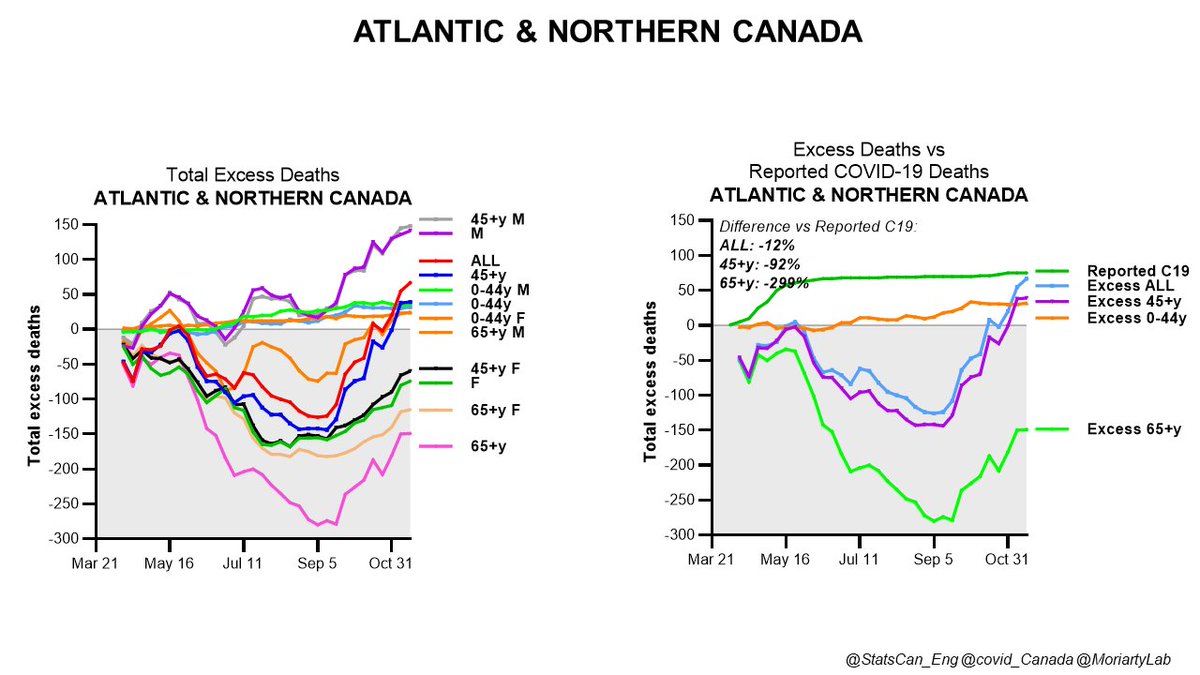
In this setting, there have been no excess deaths, and in fact there's been less death overall than in the past 5 years in these regions.
Reported C19 deaths are higher than excess deaths, but in fact this is not surprising.
Here's why....
Reported C19 deaths are higher than excess deaths, but in fact this is not surprising.
Here's why....

Recall that excess deaths are not the raw number of deaths, but are the number of deaths more than expected in a given time period, based on the average for the previous 5 years.
The majority of people who die of C19 are in their 70s or older. Not to channel GBD folks, but a certain % of these people likely would have died in the same period even without C19. So, some C19 deaths in this age group don't contribute to excess mortality during the epidemic.
If this doesn't make sense to you, let me know. It's just the math. What it means is that an indeterminate, potentially quite large chunk of C19 deaths may not show up as excess deaths because C19 primarily kills older people.
Keeping this in mind, let's go to Quebec, where reported C19 deaths are MUCH higher than excess deaths in any age group.
No, I don't think these are errors by QC healthcare providers certifying & reporting C19 deaths.
No, I don't think these are errors by QC healthcare providers certifying & reporting C19 deaths.

I suspect this difference is because so many QC deaths occurred in congregate care, where people are frail and might have died without C19. Also, during worst of Wave 1, probable C19 deaths in untested people (clinically compatible, in an outbreak context) were likely reported.
FYI probable deaths like this (clinically compatible with C19, in the context of an outbreak or close contact with a known case) are SUPPOSED to be reported, as per Canadian, WHO standards.
Legault & others don't think other provinces have been doing this, as noted by @perreaux
Legault & others don't think other provinces have been doing this, as noted by @perreaux
Also worth noting: for deaths where the person is not tested for C19, they are not considered probable C19 deaths even if the person has clinically-compatible symptoms if they are not epi-linked to a known C19 outbreak or are not a close contact of someone known to have C19.
You can see how this can become a problem for C19 death reporting if you're in the middle of a collapse of public health activities such as testing and contact tracing.
Or if some provinces are very strict about not reporting these probable deaths even if they're very likely.
Or if some provinces are very strict about not reporting these probable deaths even if they're very likely.
I digress (a lot. sigh).
Here's Manitoba. We don't have MB 2020 toxic drug death data, so these aren't adjusted. At least some of the excess deaths in the 0-44 age group are likely drug-related.
So, pressing pause on interpreting MB until we have those data.
Here's Manitoba. We don't have MB 2020 toxic drug death data, so these aren't adjusted. At least some of the excess deaths in the 0-44 age group are likely drug-related.
So, pressing pause on interpreting MB until we have those data.

Ontario.
Excess deaths in the 0-44 age group decline over time after correction for excess due to toxic drug deaths. Excess deaths in all ages older than 44 are very similar.
Note that excess deaths rise w/ reported C19 deaths in Wave 1 and from early September onward (Wave 2).
Excess deaths in the 0-44 age group decline over time after correction for excess due to toxic drug deaths. Excess deaths in all ages older than 44 are very similar.
Note that excess deaths rise w/ reported C19 deaths in Wave 1 and from early September onward (Wave 2).

Total excess deaths in ON among people 45 years and older were 27% higher than deaths in previous 5 years. This number is close to estimates from the cremation study and seroprevalence death predictions (40%).
OK. Now let's go to the province where toxic drug death-adjusted excess deaths in all age groups (including those 65+ where toxic drug deaths are uncommon) were MUCH higher than reported C19 deaths.
This is BC.
Yes, posting about this can cause some hate in my timeline.
This is BC.
Yes, posting about this can cause some hate in my timeline.

In BC, excess, drug death-adjusted deaths are 4-6 TIMES higher than reported C19 deaths (not the piddling 30-40% of ON).
Predicted deaths from seroprevalence fall right in the middle of that range (about 5X more than reported C19 deaths).
Predicted deaths from seroprevalence fall right in the middle of that range (about 5X more than reported C19 deaths).

BC is an example of a province that thought it had kept C19 case numbers and deaths under control compared to the other big provinces. People felt safer, the province caught up on its backlog of medical care, surgeries etc fairly quickly compared to others.
You still seem some excess deaths in the 0-44 age group, where most excess deaths due to toxic drugs occur. This started in the summer. This suggests the pretty strong likelihood that some drug deaths were not reported in this age group and others.

But the slope of the 0-44 excess deaths is still much more shallow than the excess death slopes for other age groups, where toxic drug deaths are much less common.
So drug deaths don't explain the excess deaths, just as medical care backlogs don't either b/c BC recovered fast.
So drug deaths don't explain the excess deaths, just as medical care backlogs don't either b/c BC recovered fast.
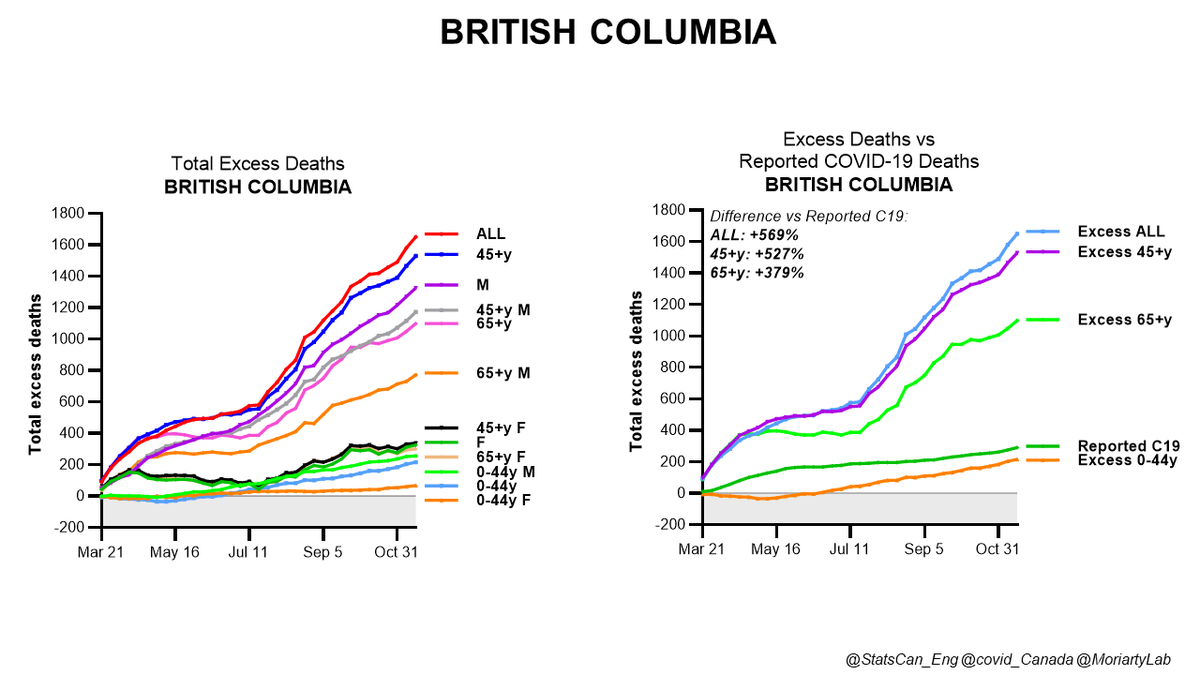
The other odd thing about BC is that there are more excess deaths in men than women. This is the opposite of QC & ON where there were more excess deaths among women (nursing homes: mainly women?).

Interestingly, in Atlantic & Northern Canada, there were fewer deaths among women 45 and older than during previous years, but not among men. This suggests that public health measures likely protected women, but not so much men.

Coming back to BC, excess deaths among women 45 and older were pretty close to reported C19 deaths (compare left and right graphs). The really high excess death numbers in BC are among men.

72% of all of BC's C19 deaths to Nov 14 were in congregate care, where there tend to be a lot more women.
https://twitter.com/MoriartyLab/status/1373455335709626378?s=20
If a LOT more older men died than in previous years, is it because BC missed a lot of C19 deaths in community?
Is this like the ON cremation analysis of excess deaths during the first wave, where 2 excess deaths occurred in residences for every 1 excess death in LTC?
Is this like the ON cremation analysis of excess deaths during the first wave, where 2 excess deaths occurred in residences for every 1 excess death in LTC?
It's really hard to know for sure what happened in BC, of course, but it's virtually certain that C19 deaths have been missed and/or have primarily been caught in congregate care settings but not elsewhere.
BC has also had real problems with long-lived smoldering/flaring C19 in north/northwestern parts of the province where presumably there is less capacity for intensive testing and contact tracing to control the epidemic in communities.
And, of course, normally you'd expect to see more deaths among men, who are more susceptible to severe C19, unless most of your deaths have occurred in congregate care, where there are typically many more women.
Enough about BC.
Now Alberta.
Alberta's drug-adjusted excess deaths among people 45 and older tracked pretty closely with reported C19 deaths until early September, when the province started losing its previously pretty tight control of the epidemic.
Now Alberta.
Alberta's drug-adjusted excess deaths among people 45 and older tracked pretty closely with reported C19 deaths until early September, when the province started losing its previously pretty tight control of the epidemic.

Alberta did a hell of a lot more testing per confirmed C19 case than the rest of the country for a long time, and as a result is the province where reported case numbers were likely closest to actual case numbers, at least until the fall.

However, from Oct-Nov 14, when excess deaths in people 45+ yrs started shooting up over reported C19, there were 70% more excess than reported C19 deaths. Death estimates from seroprevalence data for November suggest that most of these excess deaths were highly likely to be C19.

Finally, Saskatchewan. This one has also drawn some ire, because of the expectation that most C19 deaths would have occurred in hospitals. Maybe, but this wasn't true in any way in ON, where <0% of all excess deaths in Wave 1 occurred in hospital.

SK reported 29 C19 deaths up to Nov 14, but it is clear from almost any way of looking at the data that C19 deaths were likely undercounted up to this date.
First, let's look at Wave 1, where there was clearly a small spike in excess deaths that wasn't captured as C19 deaths.
First, let's look at Wave 1, where there was clearly a small spike in excess deaths that wasn't captured as C19 deaths.

Then there's a slow, erratic rise in excess deaths in all ages 45 and older over time (going up and down because some weeks there are fewer deaths than previous years, some weeks are more...the line shows the average).

Then, around October, the excess deaths shoot up in all age groups except the 0-44y, but the reported C19 deaths don't budge much at all, or are just starting to by Nov 14.

To be clear, these are small numbers and SK has a small population. I'll be more comfortable once we see excess death data into December. But the pattern we see of excess deaths leading reported C19 deaths in Wave 2 is something that can be seen in other provinces in Wave 1 and 2
Finally, predicted C19 deaths from seroprevalence data. These are higher than reported C19 deaths and excess deaths. It's likely that excess deaths in SK are in large part due to missed C19 (although from 0-44y group it looks like some drug deaths may have been missed too).

And so, my friends, here concludes my latest Joycean thread on excess Canadian deaths in the time of C19.
I hope not to post again about this until we have the next installment of excess death data from @StatCan_eng. At least next time I'll be ready w/ analytical methods.
Nite.
I hope not to post again about this until we have the next installment of excess death data from @StatCan_eng. At least next time I'll be ready w/ analytical methods.
Nite.
P.S. I know I should report this in a paper. It's kind of like I'm drafting it via Twitter!
Never before this year would I EVER have considered working through analyses publicly. But it's interesting for some, I hope, and I'm getting great peer review as I write.
Never before this year would I EVER have considered working through analyses publicly. But it's interesting for some, I hope, and I'm getting great peer review as I write.
P.P.S. I'm incredibly worried about C19 deaths in community in the 3rd wave. So worried that I keep writing these threads to explain why I'm worried, hoping that someone making decisions will feel the same uneasiness.
Good night for real this time.
Good night for real this time.
• • •
Missing some Tweet in this thread? You can try to
force a refresh