#INR Macro check
▪️ #USDINR last 74.35 => ~1.4% off 75.35 highs => RBI's persistent #USD selling above 75.00 => with soft DXY, s/t consolidation in 74.00-75.35?
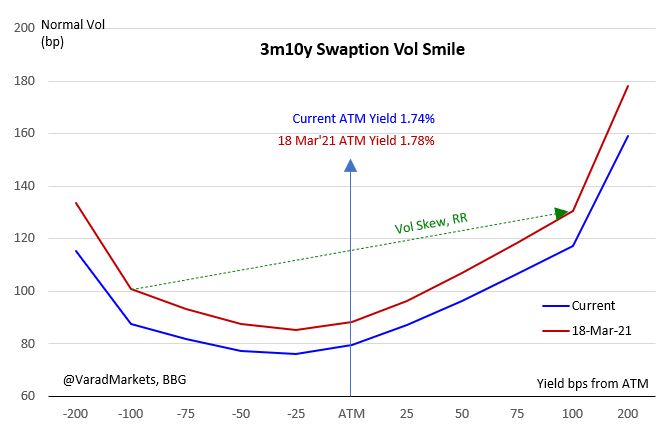
▪️ Risk Reversals, good gauge of nervousness, off highs (+1.6=>+0.9 vol) => less demand for USD Calls
1/11
▪️ #USDINR last 74.35 => ~1.4% off 75.35 highs => RBI's persistent #USD selling above 75.00 => with soft DXY, s/t consolidation in 74.00-75.35?
▪️ Risk Reversals, good gauge of nervousness, off highs (+1.6=>+0.9 vol) => less demand for USD Calls
1/11


▪️ Various economists revised India's GDP forecast lower
▪️ Good summary by @latha_venkatesh below
▪️ RBI GDP Projection +10.5% yoy FY 21/22 (Apr MPC)
▪️ Chart below: graphical overview of GDP trajectory - not that bad but whether worse yet to come?
2/11
▪️ Good summary by @latha_venkatesh below
▪️ RBI GDP Projection +10.5% yoy FY 21/22 (Apr MPC)
▪️ Chart below: graphical overview of GDP trajectory - not that bad but whether worse yet to come?
2/11
https://twitter.com/CNBCTV18News/status/1382945017140940800?s=20

▪️ When GDP collapses =>Trade Deficit tends to improve=>lower imports on poor aggregate demand
▪️ Q2 Apr-Jun'20=>massive reduction in trade deficit as GDP collapsed
▪️ Assuming only mild GDP hit in this COVID wave, associated trade deficit improvement should also be smaller
3/11
▪️ Q2 Apr-Jun'20=>massive reduction in trade deficit as GDP collapsed
▪️ Assuming only mild GDP hit in this COVID wave, associated trade deficit improvement should also be smaller
3/11

Historically, Q2 CY (Apr-Jun) worst months for India Current a/c - likely to have bearing on INR
@Macro_Maniac_ @dugalira
4/11
@Macro_Maniac_ @dugalira
4/11

▪️ India's Gold imports => massive spike; highest monthly ever, $8.5bn
▪️ Last Budget, Import duty cut to 7.5% +add cess
▪️ Could just be one-off festive demand aided by tax cut but even 6-month MA trending up
▪️ Pressure on INR in Gold import spikes (2011-13) - keep an eye
5/11
▪️ Last Budget, Import duty cut to 7.5% +add cess
▪️ Could just be one-off festive demand aided by tax cut but even 6-month MA trending up
▪️ Pressure on INR in Gold import spikes (2011-13) - keep an eye
5/11


G-SAP extra liquidity enough reason to buy USDINR?
Perspective:
▪️ G-SAP buy INR 1 trn bonds in Q2'21
▪️ Surplus Banking liquidity already ~INR 6 trn
▪️ Last one yr, FX Reserves ⬆️$100 bn=>INR 7.4 trn
▪️ Base Money INR 35 trn
Chart: BBG Liquidity vs Corridor vs TBill
6/11
Perspective:
▪️ G-SAP buy INR 1 trn bonds in Q2'21
▪️ Surplus Banking liquidity already ~INR 6 trn
▪️ Last one yr, FX Reserves ⬆️$100 bn=>INR 7.4 trn
▪️ Base Money INR 35 trn
Chart: BBG Liquidity vs Corridor vs TBill
6/11

▪️ Unlike US, India not yet looking at exponential jump in Broad or Base Money
▪️ In fact with VRR & now USD selling, RBI for liquidity normalization (withdrawal)
▪️ Lower Bond ylds coz of G-SAP => lowers attractiveness for foreign investors?
7/11
▪️ In fact with VRR & now USD selling, RBI for liquidity normalization (withdrawal)
▪️ Lower Bond ylds coz of G-SAP => lowers attractiveness for foreign investors?
https://twitter.com/VaradMarkets/status/1380114629850886145?s=20
7/11
But
▪️ RBI first has to achieve success in lowering yields with G-SAP
▪️ Even if yields lowered, total outstanding G-Sec dated sec ~INR 74 trn (~$ 1 trn) of which only 2.1% (~INR 1.5 trn or $20 bn) held by Foreign investors
@WeekendInvestng @saxena_puru @SergiLanauIIF
8/11
▪️ RBI first has to achieve success in lowering yields with G-SAP
▪️ Even if yields lowered, total outstanding G-Sec dated sec ~INR 74 trn (~$ 1 trn) of which only 2.1% (~INR 1.5 trn or $20 bn) held by Foreign investors
@WeekendInvestng @saxena_puru @SergiLanauIIF
8/11
▪️ Even if say 30% FPI pull out of G-Secs => only $6 bn outflow
▪️ YTD Bond outflow $2.3 bn
Bottom-line: INR 1 trn G-SAP can fill bond market's gap but ~1trn addl liquidity by itself should not be game changer for INR especially given size of FX Reserves & system liquidity
9/11
▪️ YTD Bond outflow $2.3 bn
Bottom-line: INR 1 trn G-SAP can fill bond market's gap but ~1trn addl liquidity by itself should not be game changer for INR especially given size of FX Reserves & system liquidity
9/11
COVID
▪️ Investor base view still appears that this Virus spike is transitory; not yet at 'blow up' stage; not enough for long term investor to pull out
▪️ Yes view can change quickly => then would be Outflow vs RBI USD selling
▪️ MTD $0.3 bn Bond & $0.4 bn Equity outflow
10/11
▪️ Investor base view still appears that this Virus spike is transitory; not yet at 'blow up' stage; not enough for long term investor to pull out
▪️ Yes view can change quickly => then would be Outflow vs RBI USD selling
▪️ MTD $0.3 bn Bond & $0.4 bn Equity outflow
10/11


CNH/INR
▪️ RBI looks at CNH/INR as well => speculation or some reality?
▪️ Intervention patterns => CNHINR support ard 10.00 earlier 2019 & 11.00 recently
▪️ Recent consolidation ard 11.30 (also 2013 peak); now 11.45 - new high
▪️ RBI to keep it stable in 11.00-11.50? Who knows!
▪️ RBI looks at CNH/INR as well => speculation or some reality?
▪️ Intervention patterns => CNHINR support ard 10.00 earlier 2019 & 11.00 recently
▪️ Recent consolidation ard 11.30 (also 2013 peak); now 11.45 - new high
▪️ RBI to keep it stable in 11.00-11.50? Who knows!

• • •
Missing some Tweet in this thread? You can try to
force a refresh