A thread on herd immunity. In summary:
- We’re not there yet
- Full herd immunity will probably arrive in late June, once we’ve vaxed all 18+
- From early June we’ll likely be in a partial-HI state where R will stay <1 with just baseline controls and cautious behaviour. 1/n
- We’re not there yet
- Full herd immunity will probably arrive in late June, once we’ve vaxed all 18+
- From early June we’ll likely be in a partial-HI state where R will stay <1 with just baseline controls and cautious behaviour. 1/n

There’s been a lot of wild claims about herd immunity in recent weeks, varying from “we’re already there” (fil.ion.ucl.ac.uk/spm/covid-19/f…) to “it’s impossible” (nature.com/articles/d4158…). Both are demonstrably wrong, and new data this week (from ONS and PHE) makes this clear. 2/n
First, the ONS-based analysis (ox.ac.uk/news/2021-04-2… ) showed us that a single dose of either AZ or Pfizer reduces covid infections by 65%. (and after 2 doses by 70%, although that’s probably an underestimate). 3/n
Secondly, the PHE study (gov.uk/government/new…) demonstrated that those few who do become infected after 1 dose of vaccine are significantly (38-49%) less likely to pass the virus on to others. 4/n
The combination of these effects means that 1 dose will reduce transmission by ~80%. The effect of 2 doses (particularly 2 doses of AZ) is less certain, but probably ~90%. This is HUGE, given that a few weeks back we weren’t even sure vaccines would reduce transmission.
5/n
5/n
So, what does this mean for herd immunity? Let’s pick a date: Mon 3rd May. Allowing for lags, we should have 49% with 1st doses and 19% with 2nd doses effective by that date. Applying the 80% and 90% factors from above, that implies a 41% reduction in total transmission. 6/n
But that’s not all; in the unvaccinated group, around 30% are likely to have been infected with covid. And the data suggests they should reduce transmission by about the same degree as those with 2 doses. So we can reduce by a further 27%, making a total reduction of 57%. 7/n
Note we’re counting children in our population totals, but we also know they’re less susceptible than adults. It’s not clear by how much, and the effect of B.1.1.7 has muddied the waters a bit, but it’s plausible we can get a further 3-4% from this – moving to 60% reduction. 8/n
Sadly, that’s not enough for full herd immunity. With an estimated R0 of 4.3 for B.1.1.7, the traditional estimate of the HI threshold is around 77% (= 1 – 1 / 4.3). If we were to open up and return to completely normal behaviour on 3rd May, R would rise to around 1.7. 9/n
It’s possible that heterogeneity effects (i.e. some people having higher contact rates &/or susceptibility to covid) could reduce that a little, but with most of the immunity being distributed uniformly by vaccination, I believe the impact is likely to be muted. 10/n
Seasonality might also help. It’s plausible that R0 will vary by at least + or -10% from its average (higher in winter, lower in summer). With this, the HI threshold in May might reduce by a couple of % points, and a bit more in June. But not by enough to bridge the gap. 11/n
So we’re not there yet. But we’re also not that far off, and things will improve as we do more jabs. Recent SPI-M papers included a revised estimate of 3.7m doses per week for the UK (up from 3.25m), which implies a faster vaxing schedule. (h/t @PaulMainwood) 12/n
Based on that, we can project our estimate of population immunity forwards, and compare it to the herd immunity threshold. We can see the likely cross-over point is at the end of June, just after we’re scheduled to open up fully. 13/n
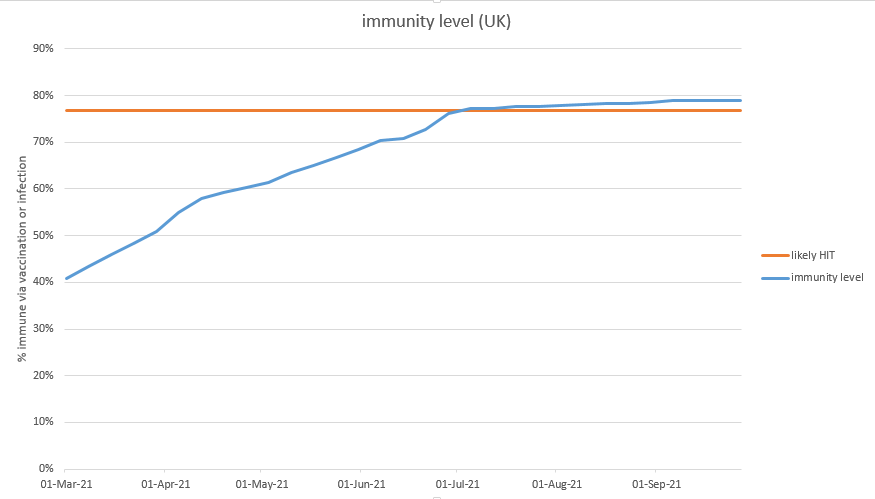
(and also at the point where we’ve given a 1st dose to every adult who wants one – note I’m assuming 85% take-up in the under-50s). If we allow for a moderate seasonality effect, that might bring the crossover forward by a week or two, into late June: 14/n
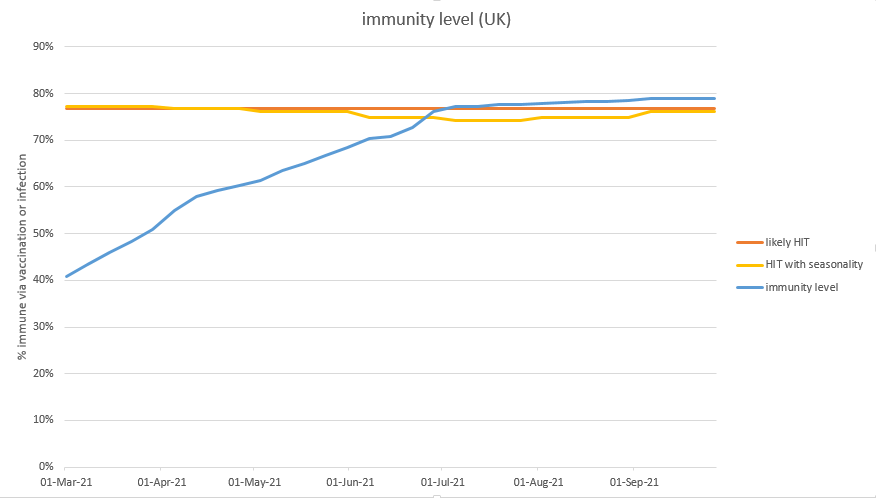
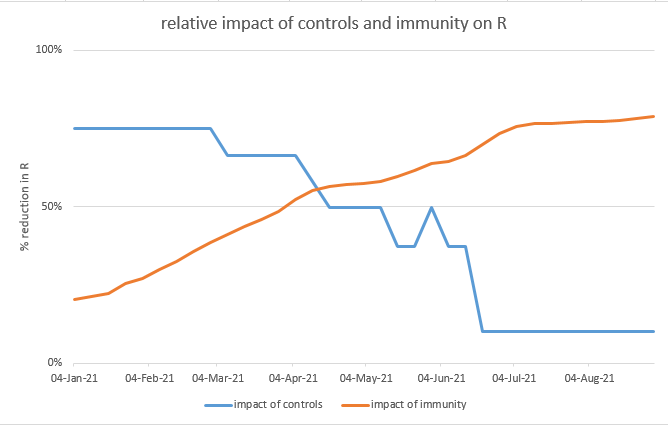
And if we further allow for the effect of some continuing ‘baseline controls’ (e.g. TTI) and some ongoing cautious behaviour (e.g. continued WFH), which together might reduce R by 10-25% (between the dashed and dotted lines), the crossover would be in early June. 15/n
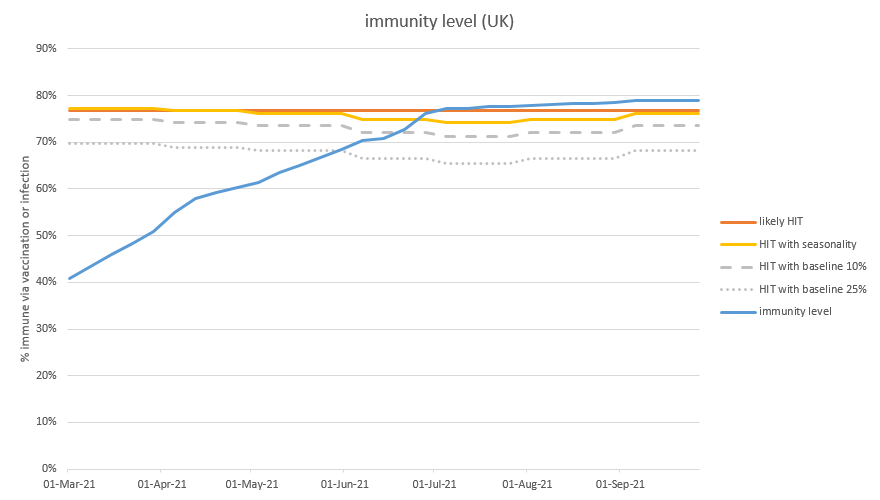
That wouldn’t be a full “herd immunity” state in the traditional sense, because changing seasons or evolving behaviour might take us back under the threshold, but it would mean that (at least temporarily) we could open up and still have R<1, which is the key thing. 16/n
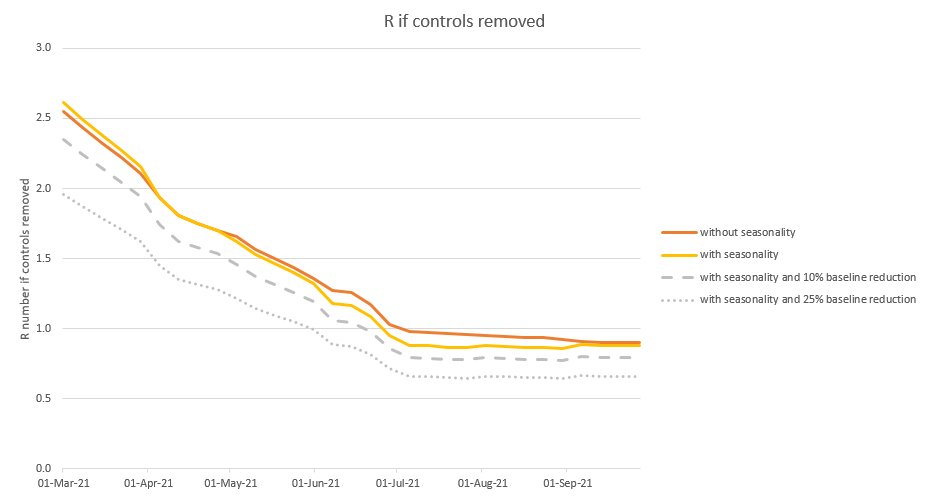
We can also look at this the other way, plotting the value of R we get from opening up on different dates: look for the point where the line crosses R=1, after which opening up becomes safer. (note the crossover dates are the same, it’s just a different way to present it) 17/n
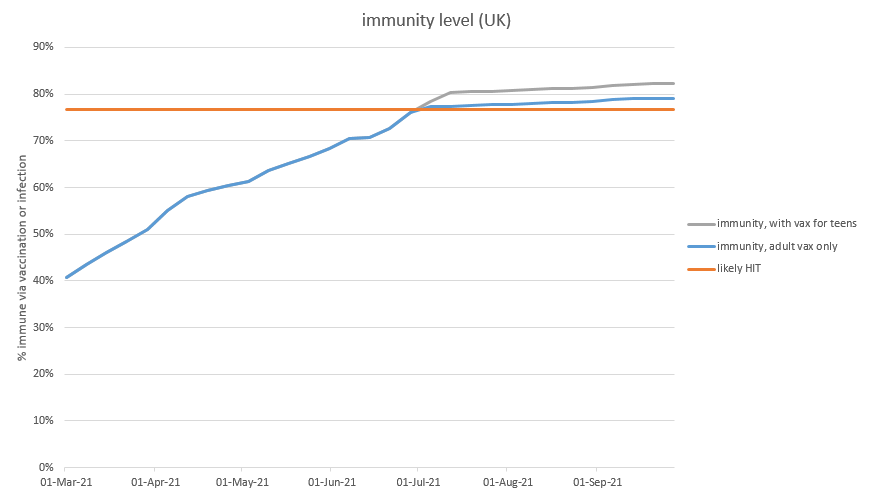
One thought: I know that vaccinating children is controversial for many reasons, but you can see from this why it could be helpful from a public health perspective. Without it, we’re poised quite delicately above the HI threshold, and it wouldn’t take much… 18/n
…(e.g. changing seasons, waning immunity, or new variants with slight partial ‘escape’ from immunity) to get us back under the threshold, and create the potential for a further wave in the autumn/winter. But even just vaxxing teenagers would give us a lot more ‘headroom’: 19/n
Of course, we shouldn’t do that unless we need to, or without robust safety trials and a positive benefit:harm ratio for the individuals. But if we can tick those boxes, then it’s definitely worth considering as a way to reduce future risks. 20/n
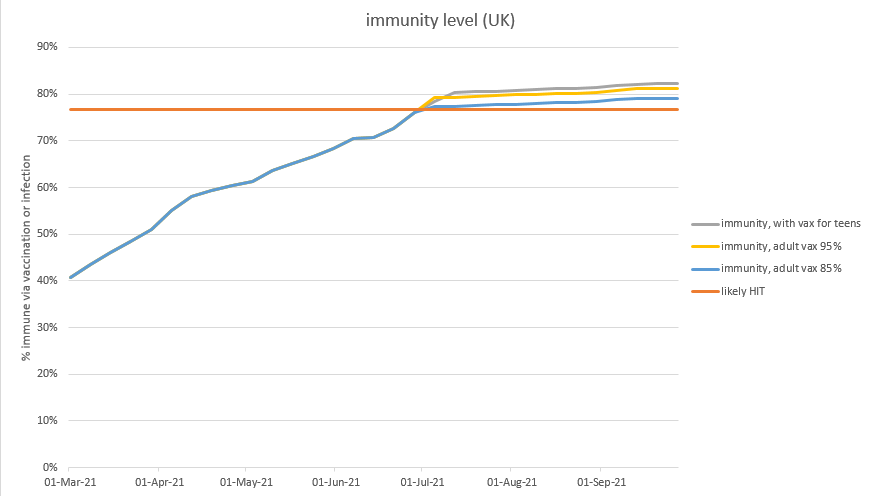
An alternative approach: drive take-up in the under-50s to 95% (matching the levels seen in the over-50s). This may be challenging, but if we can do it, we’d get nearly as much headroom as from vaxxing teenagers – at which point we might decide the latter wasn’t needed. 21/n
Final caveat: even if we have crossed the HI threshold at a UK national level, there may be local areas, age groups and communities where we’re still below. So opening up could create waves in those groups. Not (in my view) a reason not to open up, but one keep an eye on. /end
• • •
Missing some Tweet in this thread? You can try to
force a refresh