HI thread Mark II: after I tweeted last week about Herd Immunity (HI), quite a lot of people got in touch to point out that my model was either over-estimating or under-estimating the HI threshold, because it treated people as all being the same. 1/n
https://twitter.com/JamesWard73/status/1388523792234950656?s=20
And the thing is, they’re right, in both directions. Differences between groups of people, and between individuals within those groups (so-called “heterogeneity”), make it likely that I’m over-estimating the effect of vaccines, and under-estimating the effect of infections. 2/n
Let’s see if we can correct for both of these effects, or at least estimate how wrong I might be. We’ll start with the age group effect on vaccines, because that’s easier to sort out. The problem here, as @AdamJKucharski noted in his reply, 3/n
https://twitter.com/AdamJKucharski/status/1388917735166550022?s=20
…is that we’re not vaccinating people randomly, but rather in descending order of age group. This means that the early vaccinations are going to older people who are typically less sociable than youngsters, and so contribute less to transmission. 4/n
Correcting for this is easy in principle, we just need to weight each age group according to their contribution to transmission, when we’re counting up immunity levels in the population. The tricky bit is working out what the weightings for each age group ought to be. 5/n
I’ve played around with some age-group contact matrices, and also with the infection rates in each group, and derived two sets of weightings – a weak and strong version. I’m not claiming any great precision with this; it’s just a bit of guesswork to illustrate the effect. 6/n 
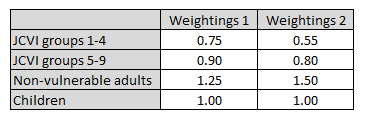
(Technical note: the first set of weightings is designed to produce an effect similar to a susceptibility-based heterogeneity model, whereas the second set of weightings is designed to mimic a contact-based model. Hence the second set is roughly the square of the first set) 7/n
Let’s see what happens if we apply these weightings to my immunity model: so when we infect or vaccinate someone in the JCVI target groups 1-4, they will count as only 75% (in the first scenario) or 55% (second scenario) of an average person. And so on for the other groups. 8/n
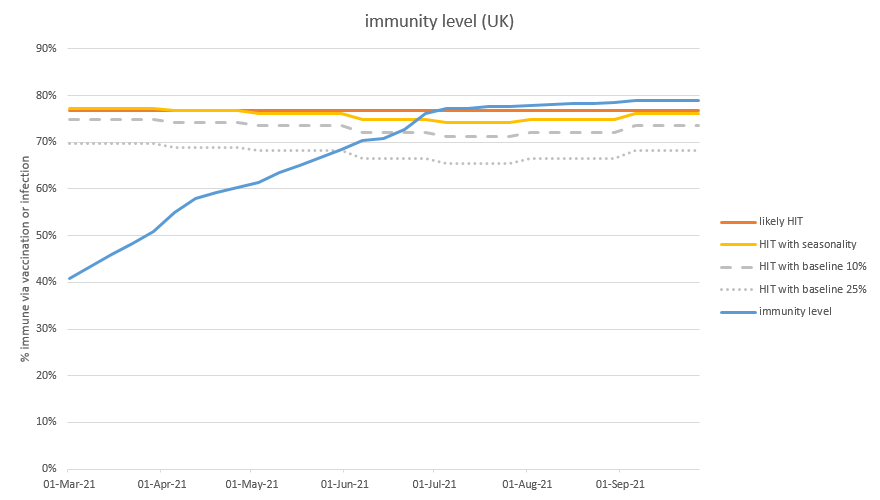
On the graph below, the blue line is my old, unadjusted, projection for how much immunity (i.e. transmission reduction) we have in the population. The orange line shows the effect of applying the first set of weightings, and the green line uses the second set of weightings. 9/n
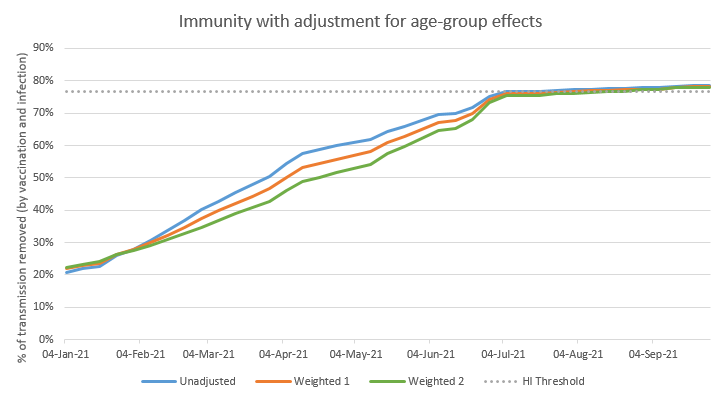
As you can see, the orange and green lines start out just above the blue line. This is because the immunity in January is nearly all infection-acquired, and biased towards the younger groups – who are weighted more strongly in the adjusted model. 10/n
But as time goes on, and we vaccinate more people, the orange and green lines drop below the blue line, because the vaccine-acquired immunity in older groups is being weighted less strongly. Then, as we come into May and June and start vaccinating the younger groups, 11/n
…the gap starts to close back up– and by the time we hit the herd immunity threshold around the end of June, there isn’t much difference between the lines. This is because, having vaxed the younger groups, immunity is now spread fairly evenly through the adult population. 12/n
(note there’s a small difference, because the younger groups are assumed to have slightly lower vaccine take-up, but this is offset by slightly higher rates of infection in those groups). 13/n
But in the short term, this chart shows that I may be over-estimating the level of transmission reduction by 4-8 %points in the short term– or in other words, my model thinks we’re 2-3 weeks ahead of where we really are. Which may be important when judging when to open up. 14/n
But remember that we were correcting for two different effects, and the other one goes in the opposite direction. This one is due to individual-level variation, and arises because infection-acquired immunity, unlike vaccination-acquired immunity, doesn’t arrive randomly, 15/n
…but instead tends to come first to those with greater susceptibility &/or contact rates – who are also those responsible for more transmission. So the first x% of those infected, and made immune, will probably account for more than x% of total transmission. 16/n
It’s traditional to think of this individual-level heterogeneity effect causing the HI threshold to be lower, but when we have a mix of vaccine- and infection-acquired immunity, it gets messy, so I’m going to stick with my approach of leaving the HI threshold at 1 – 1/R0, 17/n
…but counting people with different weights, according to their level of contribution to transmission. Hence to make this adjustment, I need to know the contribution to transmission made by the group of people who are infected, relative to the average. 18/n
Things get a bit complicated here, and again I’m not going to claim any great precision, this is just a bit of rough-cut analysis. But I noted from this recent SAGE paper: assets.publishing.service.gov.uk/government/upl… that 29% of individuals are estimated to contribute 84% of secondary cases, 19/n
… and (via several missing mathematical steps that I’m going to skip over) I can use that data to estimate that the infected group will, on average, be responsible for 1.67 times the average level of transmission. 20/n
(Note that SAGE paper is really about something else: the contribution made to transmission by interaction in different sizes of groups, and is very much worth reading. Thanks to all the authors @n3113n @JonRead15 @TAH_Sci @GrahamMedley @MattJKeeling @leondanon) 21/n
Since that 1.67 is a bit higher than I was expecting intuitively, I’ve also tested a more moderate assumption, where the infected group is only 1.33 times more transmission-y than the average. Let’s see what this does: first with that softer 1.33 times assumption. 22/n
I’ve kept the blue and green lines from my earlier graph, and I’ve added the individual variation effect to the green line (hence keeping the heavier set of age-group weightings on vaccine-acquired immunity) – and so producing the yellow line in the new chart below 23/n
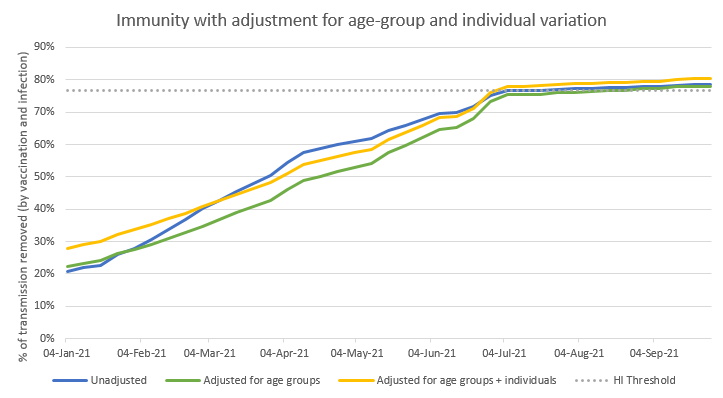
We can see that the yellow line roughly follows the shape of the green line, but a few percentage points above. The difference starts out at around 6 %points of added immunity, but over time that fades away to about 2 %points (this is because as we vaccinate more people, 24/n
…the non-random effects in the infection-acquired immunity get diluted by the more random vaccination process). In April and May, the yellow line is below the blue line (meaning that I’m still over-estimating total transmission reduction), but it crosses over in June. 25/n
Now let’s see what happens if we increase the adjustment to 1.67: the yellow line moves up, and sits comfortably above the blue line at all times. So in this scenario, I’m actually under-estimating total transmission reduction with my simple model (the blue line). 26/n

And in the medium term (July onwards), there is a noticeable benefit from the individual variation adjustment – the yellow line remains about 6 %points above the blue line, and has considerably more ‘headroom’ above the herd immunity threshold. 27/n
So what should we make of this? Am I under-estimating or over-estimating immunity in the short term? I don’t honestly know, but I’m comforted that the combination of these two effects is probably only a few %points away from the blue line (my simple model). 28/n
So it may be that I’m a couple of weeks ahead of reality, or a couple of weeks behind, but probably not much further than that (due to these effects – there may be other gaps or errors in the model). So as always, treat with care, and be mindful of upside & downside risks. 29/n
In the medium term (after the end of June), the age-group effects on vaccination immunity mostly disappear, leaving only the bonus from individual variation in infection-acquired immunity. So it’s possible we’ll have a few extra % points of additional headroom from that. 30/n
But just for the purposes of illustration, let’s take our latest graph and then add in the effect of a new variant that increases R0 by a further 50%, to something like 6.5 (but does not weaken the effects of vaccines or prior infection). 31/n
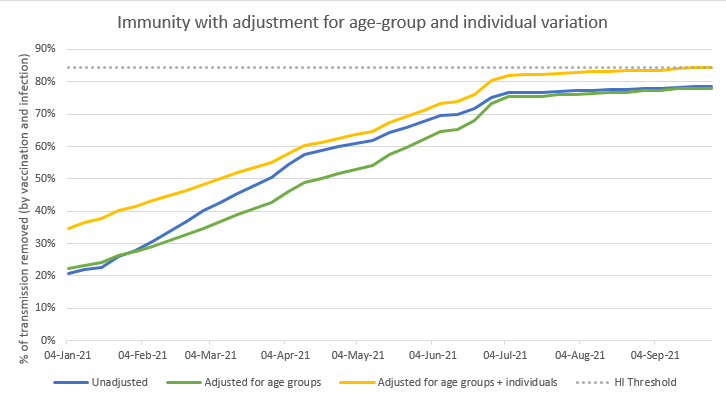
This moves the HI threshold up from ~77% to ~84% - and we can see that the yellow line just barely gets there, later in the year (but is close from July onwards). So that bonus effect might be very helpful in reducing the chances (or size) of a further wave from variants. 32/n
I hope that has given you some insight into what heterogeneity could do to my simple projections of when we will hit the herd immunity threshold. I might be a bit under, or a bit over, right now, but either way: end June is still looking like a good bet for HI in the UK. /end
• • •
Missing some Tweet in this thread? You can try to
force a refresh