My summary thoughts on B.1.617.2:
1. The data on increased transmissibility is concerning, but it’s good that a significant vaccine escape looks unlikely
2. My model suggests that we can probably still exit with only a small wave if we’re prepared to extend baseline controls,
1. The data on increased transmissibility is concerning, but it’s good that a significant vaccine escape looks unlikely
2. My model suggests that we can probably still exit with only a small wave if we’re prepared to extend baseline controls,
… and vaccinate teenagers in July.
3. We need to keep watching the data closely, and be prepared to take further action, but at present I don’t see a compelling case to alter the roadmap.
A long thread follows, with model graphs to illustrate the various scenarios/actions.
3. We need to keep watching the data closely, and be prepared to take further action, but at present I don’t see a compelling case to alter the roadmap.
A long thread follows, with model graphs to illustrate the various scenarios/actions.
Sadly I’m as confused as everyone about the data on transmissibility – but after playing around with some regression analyses, I have no reason to doubt the SAGE conclusion that a ~50% increase in transmission is a “realistic possibility”. 3/
assets.publishing.service.gov.uk/government/upl…
assets.publishing.service.gov.uk/government/upl…
It’s encouraging that there appears to be very little change in vaccine efficacy for this new variant (see below). But we’ve seen before that even small changes in VE can have big consequences, so I still want to take a look at the impact of this. 4/
https://twitter.com/TheGazmanRants/status/1393730666437779460?s=20
As a reminder, my model’s base case (prior to B.1.617.2) was suggesting no material ‘exit wave’ after we open up fully on 21st June. This assumes mild seasonality, baseline controls retained until the end of July, and no vaccination of children. 5/
https://twitter.com/JamesWard73/status/1386958495820492800?s=20
Let’s see what happens if we increase R0 during May by 20% (up to about 5.6, compared to 4.7 in the base case). Now we do get an exit wave, but not until next winter – in this case, around 21,000 deaths would arise, with peak hospitalisations c. 25% of January’s peak. 6/ 

And if we ratchet the new R0 up by 40%, to more like 6.6, we get a larger wave, this time in the autumn of 2021. Here we’d have about 28,000 deaths, with peak hospitalisations over 50% of January’s peak. 7/

If we use 60% increase in transmissibility, which is roughly where some of the UK and Indian data on B.1.617.2 is pointing to, then we have R0 7.5, with 33,000 deaths, and hospitalisations starting to approach the January peak. 8/

And finally if we go to 80% higher transmissibility, or R of 8.5 (hopefully an over-estimate), then we get ~40,000 deaths, and peak hospitalisations well above the January peak. Despite the effects of seasonality, we get the wave during this summer. 9/

None of that looks particularly pleasant, but we do have some tools still in our toolbox. Rather than showing you every scenario, I’m going to summarise the deaths in the exit wave, for different levels of transmission, as in the chart below: (this repeats the data above) 10/

Now let’s see what happens if we apply various policy actions. First, let’s suppose we could increase vaccine take-up by 10% in the under-50s, from 85% to 95% (matching the over-50s). It’s helpful, saving 6-10k lives in most cases, but not transformative: 11/

Suppose, alternatively, that we decide to vaccinate teenagers in July, before they leave school. Again, this is helpful – a bit more so than uplifting the adult take-up rate (saving more like 9-17k lives), but again not a solution on its own. 12/

Let’s recall that we have baseline controls in the model – perhaps TTI, guidance on masks in crowded spaces, and testing requirements for large events – as well as an assumption of continued cautious behaviour (e.g. WFH). Together, these are assumed to reduce R by ~25%. 13/
In the model base case, those baseline controls / cautious behaviour are removed at the end of July, because we don’t need them to control B.1.1.7 once the first-dose vaccination programme is complete. But for B.1.617.2 let’s suppose we continue them indefinitely: 14/

That’s looking quite helpful, saving 11-19k lives – in particular a 20% increase in transmissibility is now a non-event. Of course this isn’t a sustainable solution, we’ll want to remove those baseline controls eventually, but it buys us time to find other solutions. 15/
And if we combine it with other tools, we get better results. So here is a continuation of baseline controls, together with vaccination of teenagers (on the new grey line). Now a 40% increase in transmissibility isn’t too bad, and even 60% is looking a lot less painful: 16/

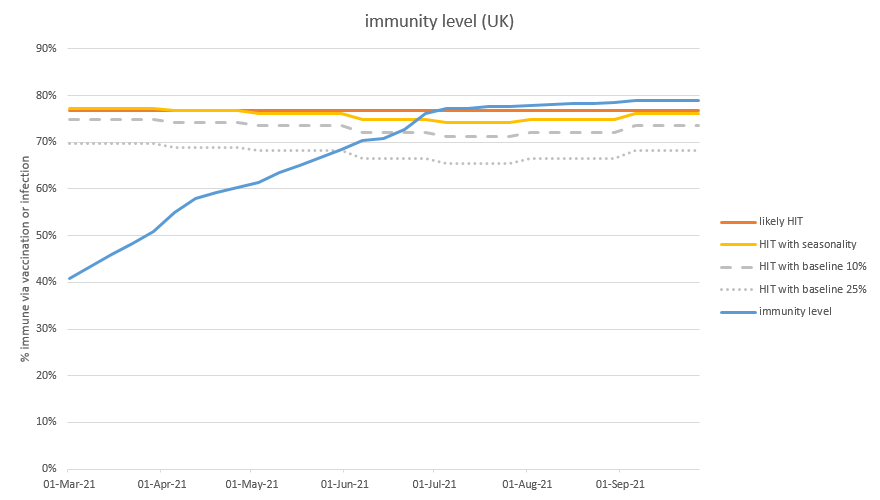
I’m feeling a bit better now – there are definitely things we can do to combat this new variant. One further thought: you may have seen last week I developed some thoughts on heterogeneity and its impact on herd immunity (see thread below). 17/
https://twitter.com/JamesWard73/status/1391514744360775682?s=20
If we take these ideas, and apply them into the core model, using a parameter of 1.5 for the bonus on infection-acquired immunity, this also has a significant effect. Here, on its own, saving 18-23k lives vs. the unadjusted impact curve: 18/

And if we add this effect to our scenario with extended baseline controls and vaccination of teenagers, there is a further reduction in deaths for the severe scenarios. This might not be something we want to rely on, but it’s helpful that it could be an upside in our models. 19/

I said at the start that I wanted to look at the impact of small levels of immunity escape. Note I’m looking here only at reducing the impact of vaccines and prior infections in cutting transmission – I’m assuming that protection vs. severe disease will be maintained. 20/
But if we have around 75% of the population immune, and lose 10% of that protection, that’s adding 7.5% of the population to the ‘susceptibles’ category – which is initially similar in its effect to an increase in transmissibility (R0) of about 30%. 21/
And the result isn’t pretty: a wave of 35,000 deaths in the winter, with peak hospitalisations approaching those of last January. 22/

If we go further and lose 20% of the built-up immunity to transmission, it gets worse: with ~45,000 deaths and peak hospitalisations well above those of January. A similar result can be obtained from a combined effect e.g. 10% loss of immunity and 40% increase in R0. 23/

(Note: please disregard the timings of the waves in these last two charts, this is an artefact of the way I have modelled the new variant, which is assumed to become dominant in September. With the variant actually arising during May, the waves could arrive much earlier). 24/
So this is a more worrying scenario, but again it can be mitigated by sensible policy-making. Looking at the chart, you can see that the combination of extended baseline controls, and vaccination of teenagers, enables us to (mostly) deal with a 20% escape – but not 30%. 25/

Overall, I still think this is encouraging – we have tools at our disposal to deal with some bad news from B.1.617.2, provided it doesn’t get too bad. And an increase in R0 of 80%+, or an immunity escape of 30%+, both look unlikely on the data we have so far. 26/
There’s a couple of big caveats I need to apply. One is that (as noted previously) my model is not stratified by region, and only partially by age, so will miss more subtle effects. Even when the model says we’re over the herd immunity threshold, it is still very possible… 27/
…to have local outbreaks (e.g. as in Bolton right now) in areas where prior infections or vaccination take-up are low, or that have high natural R0 due to population density, deprivation etc. So additional local actions may need to be taken to control these outbreaks. 28/
Secondly, you will have noted that other models make different predictions. In particular, the Warwick model that feeds into SPI-M and SAGE (see below) can absorb only ~20% increased transmissibility before it starts producing large waves: 29/

This is not a surprise – as regular readers will know, my model can be configured to produce very similar results to Warwick, but its base case is slightly more optimistic – and so can absorb a bit more bad news before things start getting nasty. 30/
I’ve previously documented the differences between the two models (see below), and none are huge on their own – the most significant is that I make an adjustment for children being less susceptible, which I don’t think Warwick does. 31/
https://twitter.com/JamesWard73/status/1392065088182489090?s=20
(note the differences in R0 and vaccination schedule in that thread are no longer relevant, as I have subsequently adjusted my model to align with Warwick. Also I have removed vaccination of teenagers from the base case, and limited the duration of baseline controls). 32/
To be clear, I’m not saying “I’m right and they’re wrong”: the differences in the models are now relatively small, and debatable either way. And of course “they” are professionals with many decades of experience and I’m just a random guy on Twitter with a spreadsheet. 33/
But I think it’s still helpful to note that with relatively small changes to the model initial conditions, we bring the impact of a 40-60% increase in transmissibility into the range where actions such as extending baseline controls, and vaccinating teenagers, can handle it. 34/
So, what do I think this all means from a policy perspective? There’s no doubt that the timing of tomorrow’s Step 3 opening is unfortunate, it would be much better to have another week or two’s data to decide on what to do next. But having made the decision to open up, 35/
…I’m not currently seeing a compelling case to change track on the roadmap right now. The next few weeks could be bumpy, with more local outbreaks as per Bolton / Blackburn, but I’m not expecting a major wave to start before we open up fully on June 21st. 36/
That view could change, and we should certainly be watching the data closely for any sign that we need to delay Step 4 or (in the worst case, which I don’t expect) reverse Step 3. I do believe we should be prepared to add three policy elements to our Step 4 plans: 37/
1. My previous view was that baseline controls were unlikely to be needed to control B.1.1.7 beyond the end of July. But with B.1.617.2 now likely to become dominant, it makes sense to extend those controls until we believe the prospect of a large exit wave has receded. 38/
2. In my mind, there is now a strong case for vaccinating teenagers in July. If we don’t want to do that, or if the safety/risk analysis doesn’t permit it, we’ll need to put every effort into getting the 18-50s take-up into the same 95%+ range as the over-50s. 39/
3. If (and again, I don’t expect this), there are signs of a material immunity escape by B.1.617.2, then we’ll need to be preparing boosting vaccines attuned to this new variant for delivery as soon as possible. 40/
In the worst case, additional controls (e.g. reversal of Step 3) could be needed to hold the virus in check until those boosters are available for delivery – see this thread for discussion, the numbers are out of date but the “shape” will be similar: 41/
https://twitter.com/JamesWard73/status/1383112993576210438?s=20
In summary, I believe the UK can deal with most of the possible scenarios we could face with B.1.617.2 over the coming months. It may be bumpy, but I think we’ll get there. Other countries – with less vaccination or prior infection – may face an even more challenging time. /end
• • •
Missing some Tweet in this thread? You can try to
force a refresh