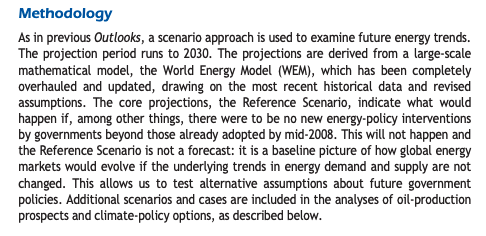
In its WEO 2008 the IEA "reference scenario" suggested coal power would reach 12,000TWh by 2020

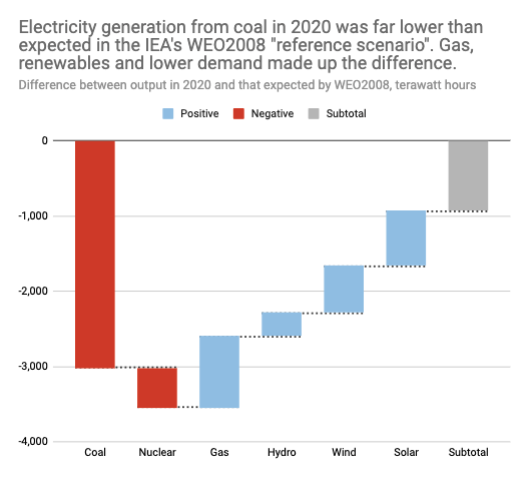
In reality, coal was 25% lower (-3,000TWh, equiv of overall EU demand)

Solar output was 8x higher than expected
Wind nearly twice as high

What else was different?

1/

HT @KetanJ0
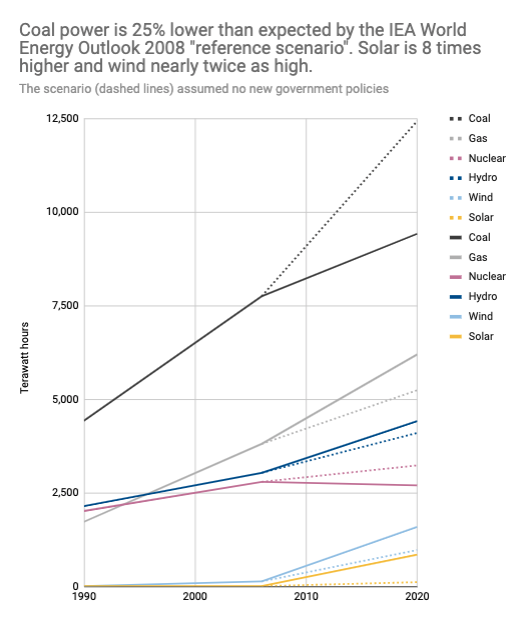
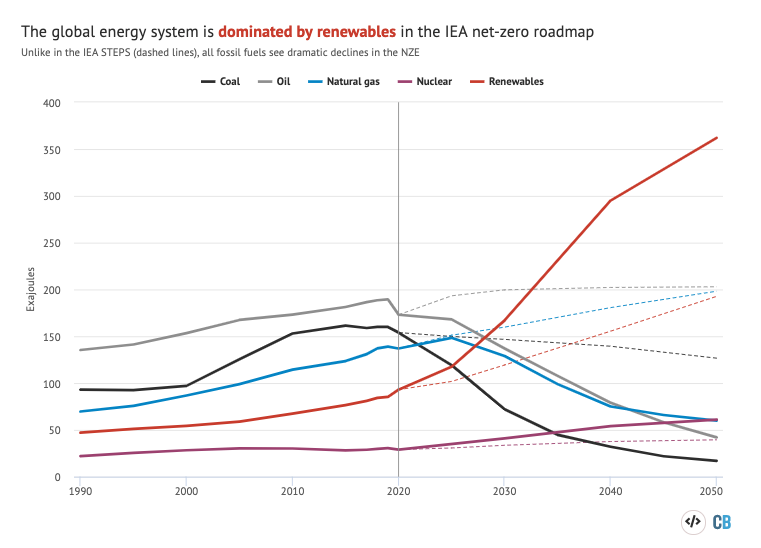
Gas, hydro, wind and solar all significantly outperformed the IEA's reference scenario expectations from 2008, whereas nuclear and coal were lower

Demand overall was lower than expected, too

2/
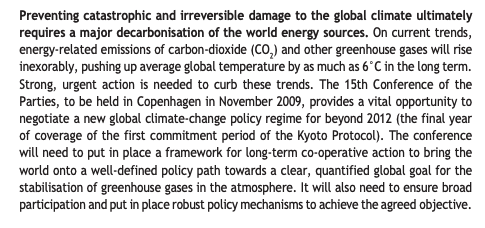
There are at least two ways to read this

A) yah boo, the IEA got it wrong on renewables (again)
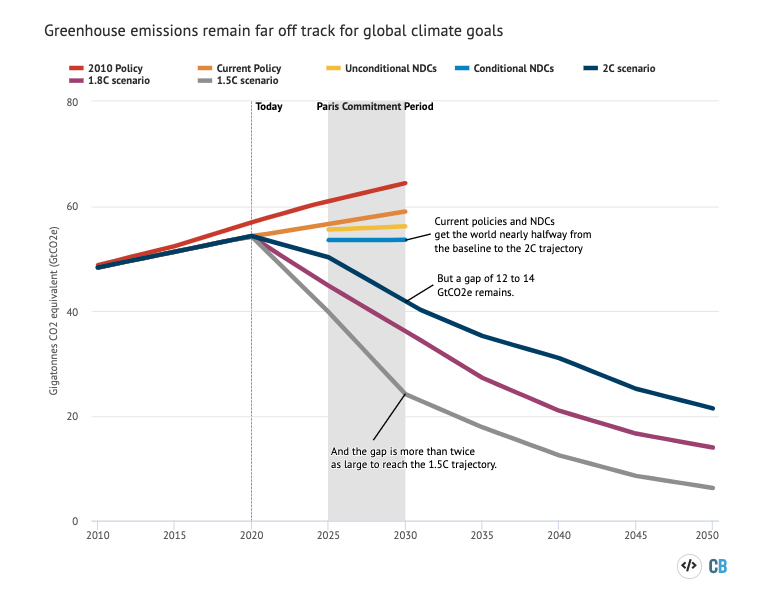
B) the world implemented a lot of new climate policy since 2008, beyond the static view of the 2008 "reference scenario" (pic)

…but really it's (C), a mixture of both

3/
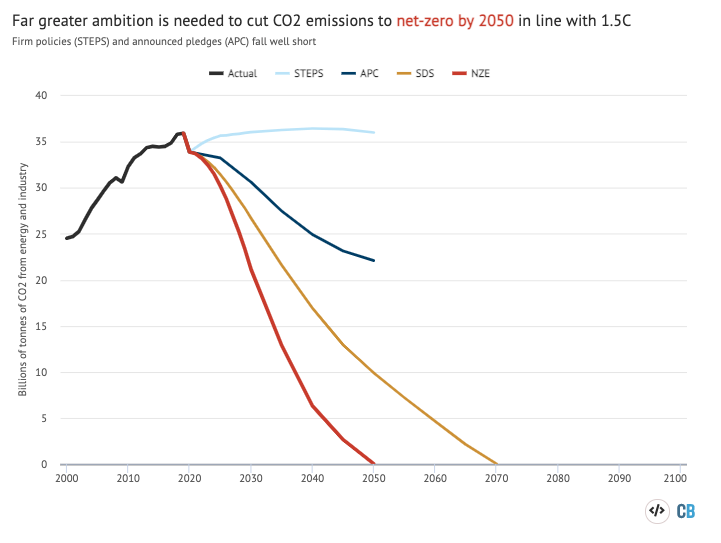
Contra the oft-repeated idea that the world has made little progress on climate change, there is a huge difference between where we are today and the "on current trends…as much as 6C" expected in 2008

4/
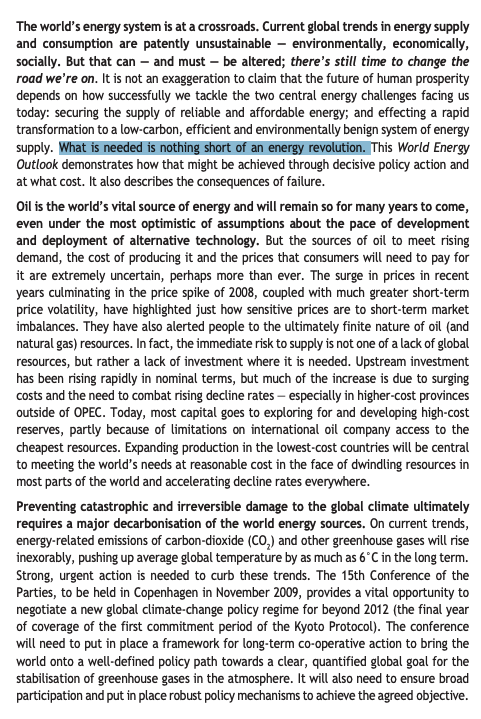
Finally, as @fbirol did last week by looking at WEO2009, it's fascinating to look back at how WEO2008 talked about the climate challenge:

"what is needed is nothing short of an energy revolution"

5/ends

iea.blob.core.windows.net/assets/89d1f68…
Here's the tweet from @KetanJ0 than inspired my thread

• • •

Missing some Tweet in this thread? You can try to force a refresh
 

Keep Current with Simon Evans

Simon Evans Profile picture

Stay in touch and get notified when new unrolls are available from this author!

Read all threads

This Thread may be Removed Anytime!

PDF

Twitter may remove this content at anytime! Save it as PDF for later use!

Try unrolling a thread yourself!

how to unroll video
  1. Follow @ThreadReaderApp to mention us!

  2. From a Twitter thread mention us with a keyword "unroll"
@threadreaderapp unroll

Practice here first or read more on our help page!

More from @DrSimEvans

18 May
THREAD

So many remarkable things in today's @IEA net-zero by 2050 report. Here are a few:

⛏️ immediate end to new fossil fuel extraction
🏭 unabated fossil energy plummets

-98% coal
-91% oil
-88% gas

🌞 solar becomes largest energy source

1/

carbonbrief.org/iea-renewables…
IEA boss Fatih Birol calls the net-zero scenario "the energy future we all need to focus on"

Not hard to see why:

🌡️ avoids 1.5C
⚡️ universal energy access
😷 2m fewer premature pollution deaths
💵 increases global GDP

2/

carbonbrief.org/iea-renewables…
There's one big problem…

The world's currently on track for 2.7C (STEPS)
Even all the net-zero goals mean 2.1C (APC)

…leaving a 22GtCO2 ambition gap in 2050 to stay below 1.5C (NZE)

"[the] gap between rhetoric and action needs to close"

3/

carbonbrief.org/iea-renewables…
Read 8 tweets
23 Apr
The UK govt has formally issued draft legislation, making its 78% by 2035 climate goal into law

legislation.gov.uk/ukdsi/2021/978…
It does not (yet) legislate to include international aviation and shipping in the budget, but additional regulations on that will follow

legislation.gov.uk/ukdsi/2021/978…
for reference, here's Article 30 of the Climate Change Act under which international aviation and shipping will be included

legislation.gov.uk/ukpga/2008/27/…
Read 9 tweets
23 Apr
How big are the new climate pledges from the US, UK, EU, Canada & Japan?

I reckon they could cut emissions in 2030 by roughly an extra 2bn tonnes of CO2e

That's quite a lot…

…but still tiny compared with the 12-32GtCO2e "emissions gap" to 1.5 or 2C

carbonbrief.org/unep-net-zero-…
This is very much a back-of-the-envelope number and depends what you assume would have happened, before the new pledges.

We can expect to see more sophisticated estimates from @climateactiontr & @UNEP
@climateactiontr @UNEP Also – this assumes the new ambitions are turned into reality

That's very much a big "if"
Read 4 tweets
22 Apr
We've now had four big new climate goals announced

UK -68% below 1990
EU -55% below 1990
US -52% below 2005
JP -46% below 2013

Who is most ambitious?

Depends on the baseline…

1990 UK>EU>US>JP
2005 UK>US>EU>JP
2013 UK>US>EU>JP
2018 US>UK>EU>JP
For those that prefer ugly spreadsheet tables…
Read 4 tweets
29 Mar
The world's electricity over the past 30yrs:

1990 🏭🏭🏭🏭🏭🏭💦💦☢️☢️ (64% fossil)
2000 🏭🏭🏭🏭🏭🏭💦💦☢️☢️
2010 🏭🏭🏭🏭🏭🏭🏭💦💦☢️
2020 🏭🏭🏭🏭🏭🏭💦💦☢️🌄 (61%)

😭😭😭

Plus ça change? 🧵

(Data: BP / @EmberClimate)
Here's the same data in chart form…

Fossil fuels supplied 64% of the world's electricity in 1990 and that fell by just 3 percentage points over the following three decades to 2020 (61%)
But let's take a peak underneath the bonnet…

To begin, let's make this *even more depressing* by looking at amounts as well as percentages

Because fossil electricity supplies have *more than doubled* since 1990 – and that what matters for CO2

(even tho gas better than coal)
Read 9 tweets
26 Mar
Wow OK, so the UK's land sector is now a source, not a sink of greenhouse gas emissions

Needs to be a sink if UK is going to reach net-zero…

What happened? 🧵
I noticed the switch because it helped make my annual estimate of UK emissions less accurate than usual

But I wasn't sure what was going on until now (and I suspect this still isn't the whole story)

Thanks to @mattadamw @stv_smth @david_joffe for pointers!
Read 15 tweets

Did Thread Reader help you today?

Support us! We are indie developers!


This site is made by just two indie developers on a laptop doing marketing, support and development! Read more about the story.

Become a Premium Member ($3/month or $30/year) and get exclusive features!

Become Premium

Too expensive? Make a small donation by buying us coffee ($5) or help with server cost ($10)

Donate via Paypal Become our Patreon

Thank you for your support!

Follow Us on Twitter!

:(