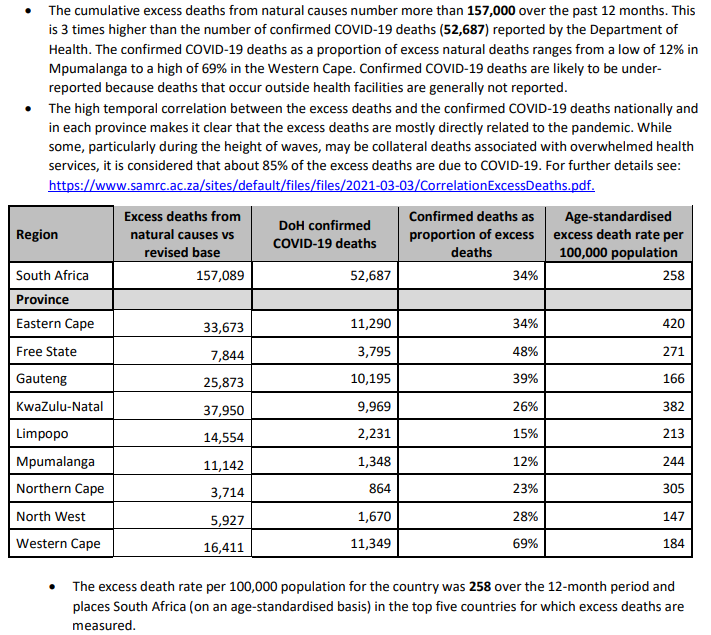
Latest @MRCza and @UCT_news report out on excess deaths in South Africa, covering the week to 22 May 2021. Natural excess deaths close to 162 000 since 3 May 2020, with increment of 1 500 this last week. Report available here: samrc.ac.za/reports/report…
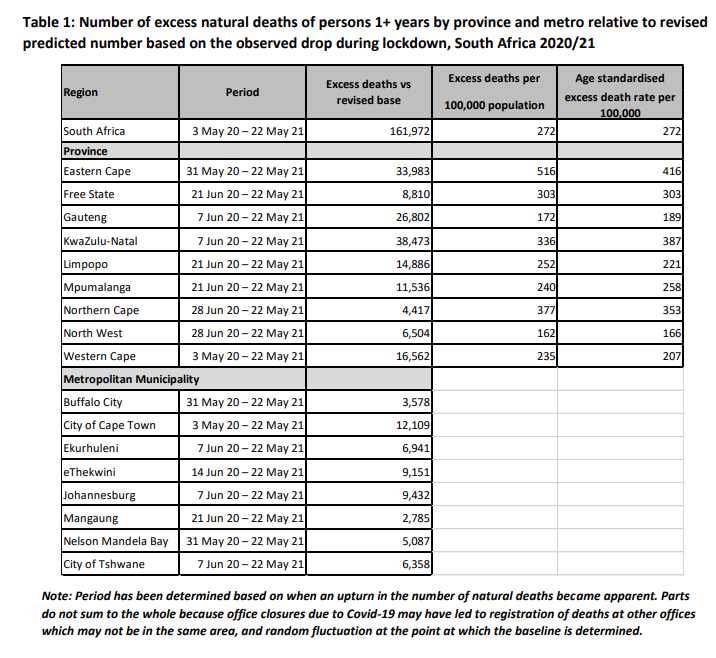
The adopted measure of excess mortality, the p-score - observed:expected, as a percentage, remains low, except in FS (+74% above expected), NC (+94%), NW (+31%), and - increasingly - Gauteng (+28%).
Nationally, still on the low side at +19%.
Unnatural deaths continue to follow the expected pattern closely
On the testing side, clear increases in proportions testing positive in all provinces, although markedly higher in the inland provinces (i.e. other than WC, EC, and KZN) in the week ending 22 May 2021.
The age plots show the third wave in NC, FS, NW, and starting in GT.
• • •
Missing some Tweet in this thread? You can try to
force a refresh
The @MRCza and @UCT_news collaboration that produces the weekly excess deaths report has just published a summary of mortality in South Africa for calendar year 2020. samj.org.za/index.php/samj…
Estimated deaths over the full year were 13% higher than expected. This includes the 4 months before Covid deaths became apparent, but excludes the peak of the second wave that happened in early 2021. /2
There were 70-76k excess deaths, a level equivalent to the 73 500 anticipated deaths from HIV/AIDS, the single largest cause of death in the country. /3
Latest @MRCza and @UCT_news report on excess deaths released. 160 000 excess natural deaths 3 May 2020-15 May 2021, an increase of 1 380 since last week. Report here: samrc.ac.za/reports/report…
p-scores (observed natural deaths as a % of expected natural deaths) have increased slightly in SA - now 17.2% higher than expected this week - and in most provinces. Northern Cape exceeds 100% extra mortality for the first time (ever). Free State remains above 50%
Unnatural deaths continue to follow the expected trend very closely.
Relative to expected, mortality remains particularly high in NC and FS (both > 50% higher than expected).
Last week marked 1 year since we first identified excess deaths at a national level in the data. On an age-standardised basis, South Africa ranks in the top five countries for which excess deaths are
measured.
Excess deaths nationally at 250/100k, with (after adjusting for age structure) highest in EC (405) and KZN (366). Lowest in Gauteng (171).
Some provinces (EC -- 11%, WC --11%, NW --14%) have p-scores (observed to expected deaths in the week, expressed as a %) approaching zero and in some cases at below the upper prediction bound.
New @mrcZA excess deaths report released today. 132 000 excess natural deaths from 3/5/20 to 30/1/21, up 7 000 from last week, a substantial reduction from the the 15.7k in week 2 and 12.5k in week 3.
50k excess deaths since 27/12/20.
Report here: samrc.ac.za/reports/report…
Sharp reductions in excess deaths nationally, and in all provinces (e.g. ZA and WC)
p-scores (observed deaths::expected deaths) continue to decline in every province:
Quite a few people have been sharing a copy of part of a South African death certificate #onhere, (including some medical practitioners) claiming that this shows that Covid deaths are being exaggerated, misidentified, and misreported. A thread on Cause of Death Certification. /1
2/ What was being shared? Let’s look at one of the images.
3/ The Notification of Death form in South Africa, DHA1663, is in two parts. A sample can be found on pp9-12 of this document: samrc.ac.za/sites/default/…