$BTC Are we in Accumulation or in Distribution?
Here is our bullish hopium that shows this might just be the accumulation before more upside. 📈
Let's dive in.
Here is our bullish hopium that shows this might just be the accumulation before more upside. 📈
Let's dive in.
https://twitter.com/DaanCrypto/status/1383463941272084485

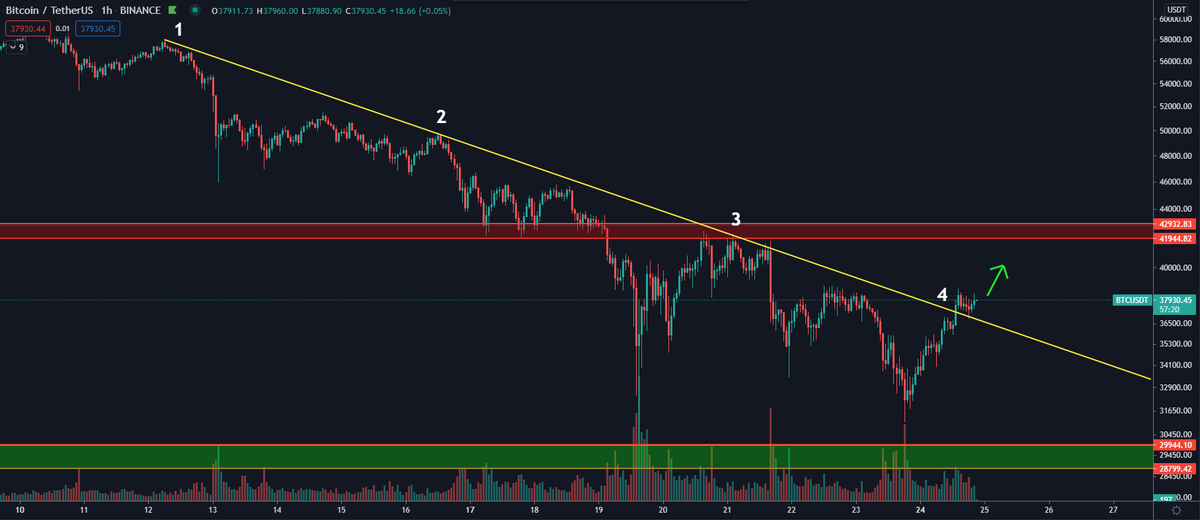
First off, the real question is: Is this range accumulation or re-distribution?
The answer to that question will determine whether we eventually break up or down out of this range ($30-43K).
Wyckoff can give us a good indication of what we're working with.
The answer to that question will determine whether we eventually break up or down out of this range ($30-43K).
Wyckoff can give us a good indication of what we're working with.
The most telling factor here, will be the volume. If this were to be a distribution range, like we've seen at the top, we would be seeing increased volume on the sell-offs.

Currently, we're seeing the opposite happen. This can be an indication of supply drying up on each test and thus meaning, accumulation is in progress.

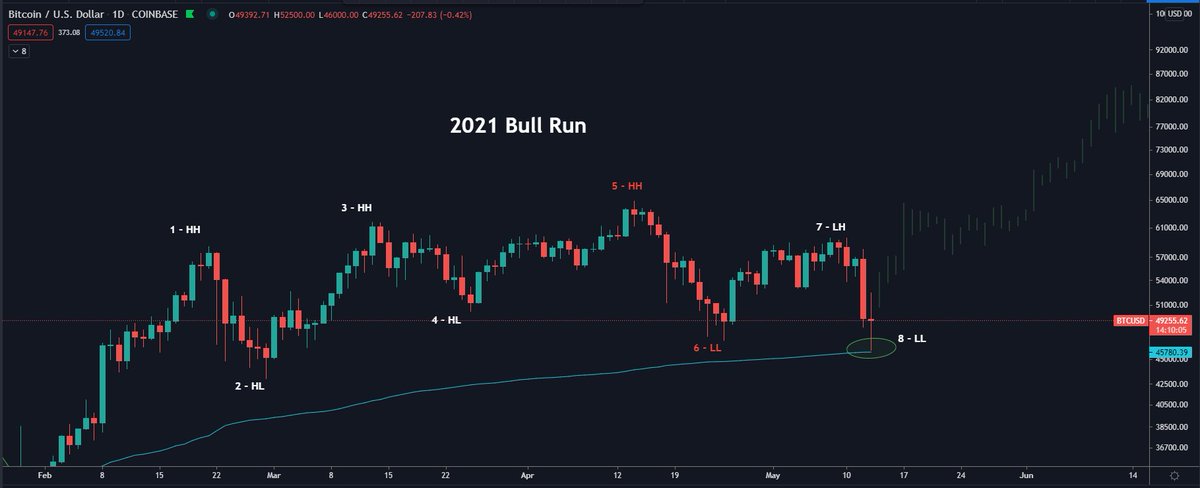
Do keep in mind, that accumulation and distribution ranges can look very similar in terms of price movements. That's why the volume is so important.
We should be keeping an eye on the higher and lower end of the range and see how price reacts there.
We should be keeping an eye on the higher and lower end of the range and see how price reacts there.
If we were to take the range highs, get dumped below it and see increased selling volume on every move down, that'd be a bearish sign.
Overall, we should be seeing lower volume on each move down indicating a dried up supply in this range.
This would end up in a break up higher.
Overall, we should be seeing lower volume on each move down indicating a dried up supply in this range.
This would end up in a break up higher.
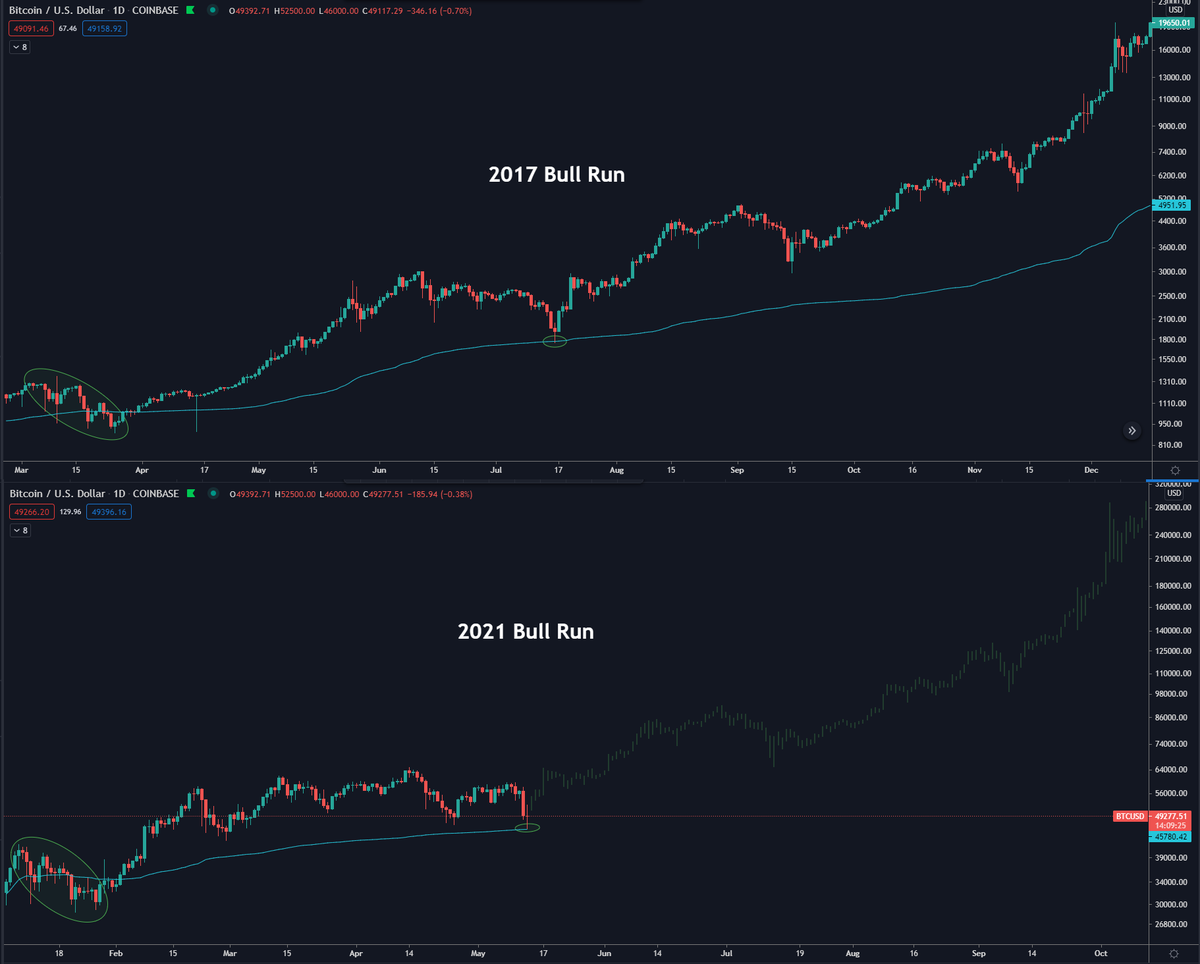
As for the chart comparison, the ST in Phase B doesn't have to touch the SC level like the picture implies.
Source here: school.stockcharts.com/doku.php?id=ma…
Source here: school.stockcharts.com/doku.php?id=ma…

Besides that, the green doodle I drew is just an indication of where we may be. The entire Phase B & C are mostly sideways chop without setting any significant highs or lows so it's still unclear where we are exactly and how long it may take before we really enter Phase D.
From a trading perspective, you're probably best off to wait for more clarity. We can after all, still test the SC and extend this range further. That would give you a better long entry.
Alternatively you can just wait for a proper breakout of the range which is a lot safer.
Alternatively you can just wait for a proper breakout of the range which is a lot safer.
For now, this is all we can work with.
I hope this was educational for some of you. I'm still learning a lot about this as we go but it's surely very interesting.
Thanks for reading! 📚
I hope this was educational for some of you. I'm still learning a lot about this as we go but it's surely very interesting.
Thanks for reading! 📚
To add to this:
No one was really looking at Wyckoff prior to the dump we've had. Now all of the sudden it has gotten a lot of interest.
We've seen these things happen before, where certain patterns don't occur anymore once the majority catches on to it.
Good to keep in mind.
No one was really looking at Wyckoff prior to the dump we've had. Now all of the sudden it has gotten a lot of interest.
We've seen these things happen before, where certain patterns don't occur anymore once the majority catches on to it.
Good to keep in mind.
• • •
Missing some Tweet in this thread? You can try to
force a refresh