Eric Profile picture
1 Jun, 19 tweets, 7 min read
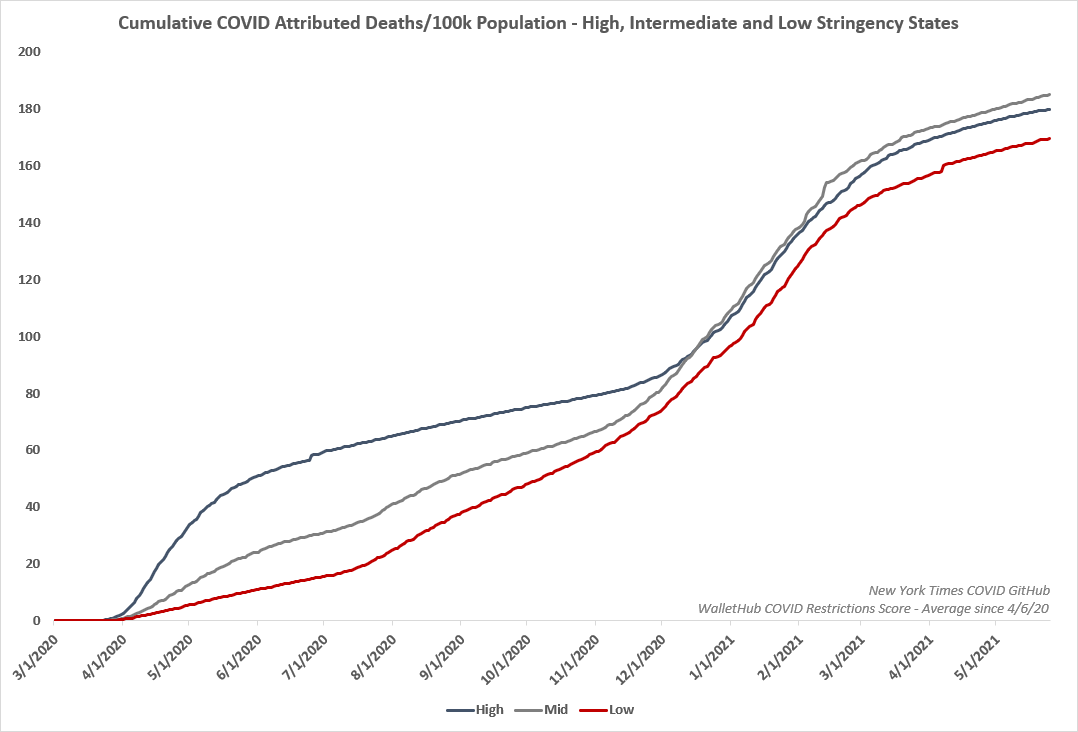
1/ With the pandemic finally, thankfully winding down in the US, I thought I'd compare the COVID death curves of high, intermediate and low-stringency states. Despite a large surge in Spring 2020, the high-stringency states still saw a similar surge this past winter.
2/ Looking at COVID deaths cumulatively, high, intermediate and low-stringency states performed about the same. It may be tempting to say low-stringency states performed "better", but it's more honest to say there's really no statistical difference between the three.
3/ And, if you like your charts very busy, here is a graph with both daily and cumulative COVID deaths per 100k, plus a map displaying what category each state falls in based on WalletHub's methodology.
4/ It's obvious over the past 15 months that the COVID pandemic response has been extremely political. When you organize the high, intermediate and low-stringency states by its governor's party, there is an obvious trend - D governors = strict policy, R governors = lax policy.
5/ This is obviously a problem. Hopefully we can all agree political bias should not drive scientific consensus or policy - but one's opinions on nearly every COVID issue, whether it's masks, school closures, lockdowns etc. have mostly aligned with one's political party.
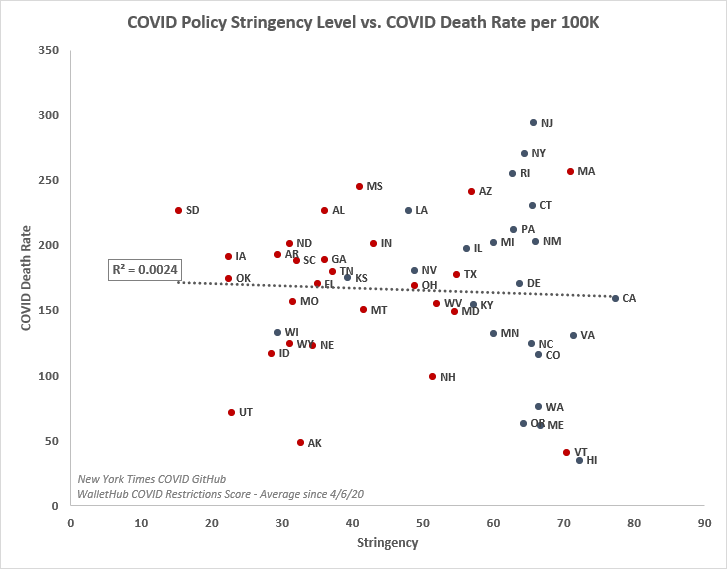
6/ Politics drove COVID policy - but did more stringent policies lead to improved outcomes? Plotting a state's average stringency vs. it's death rate, it's very obvious a) republican-led states were less stringent, and b) there is no relation between stringency and death rates.
7/ A common narrative over the past year was "we need to lock down/tighten our COVID policies to help the economy recover faster" - yet there is a very clear correlation between more lax COVID policies and stronger economic recovery.
8/ Policy didn't do much to affect the pandemic curve. So what actually did?

You can see the most stringent states' populations actually tend to be farther north (higher latitude), intermediate are in the middle, and less stringent states tended to be south (lower latitude)
9/ Based on Hope-Simpson seasonality one can assume that the farther north you are, the more you will align with the "North Temperate" pandemic curve. Here is the Hope-Simpson N. Temperate curve compared to the strict (high latitude) COVID death curve (h/t @Hold2LLC)
10/ The intermediate states were the most "in-between" north temperate and north tropical, so here is their death curve compared to the Hope-Simpson combined N. Temperate/N. Tropical seasonal curve.
11/ And finally, the low-stringency states (mostly Southern and Sun Belt states) had the lowest average latitude. You can see they saw increased activity in the summer with a peak in winter - similar to what Hope-Simpson observed years ago.
12/ While you can see a pattern based on stringencies organized by latitude, you get a much clearer pattern when organizing strictly by region. Here are population-adjusted COVID hospitalizations in the Midwest (with average highlighted).
13/ And the Sun Belt/South.
14/ And the Northeast.
15/ And here they are on the same plot.
16/ So COVID policy didn't affect pandemic trajectory, but seasonal/regional factors did. Yet for some reason scientific elites continue to perpetuate the lie that lockdowns etc. drive down infections - despite continually mounting evidence to the contrary
17/ A lot of this probably comes from the human tendency to want to think we are in control, when in reality we aren't. And, unfortunately, this human vanity project came with catastrophic cost, and virtually no benefit. telegraph.co.uk/news/2021/05/3…
18/ And therein lies a big problem - the same people who pushed for lockdowns, school closures etc. over the past year are now professionally incentivized to downplay the harms of the policies they advocated for while exaggerating their efficacy. They need to be held accountable.
19/ This is why the work of organizations like @collateralglbl is so important - tracking the devastation from these policies, whether it's exacerbating hunger, delaying preventative treatments, worsening mental health, etc. - we need to make sure lockdowns are never used again.

• • •

Missing some Tweet in this thread? You can try to force a refresh
 

Keep Current with Eric

Eric Profile picture

Stay in touch and get notified when new unrolls are available from this author!

Read all threads

This Thread may be Removed Anytime!

PDF

Twitter may remove this content at anytime! Save it as PDF for later use!

Try unrolling a thread yourself!

how to unroll video
  1. Follow @ThreadReaderApp to mention us!

  2. From a Twitter thread mention us with a keyword "unroll"
@threadreaderapp unroll

Practice here first or read more on our help page!

More from @The_OtherET

19 May
Hey @KCStar this piece is just awful. Unvaccinated kids are at about the same risk of COVID as a vaccinated 30 year old. Unmasked schools had about the same or *better* case rates than masked schools. This article, of course, mentions none of this. amp.kansascity.com/opinion/editor…
There is literally nothing of substance in this piece except a brief mention of community vaccination rates. It mentions nothing of the relative risk of kids compared to adults, or how masks don’t appear to make any difference at all in schools. Just the ramblings of a fanatic.
Really - data show masks don’t make a difference in schools.
Read 4 tweets
7 May
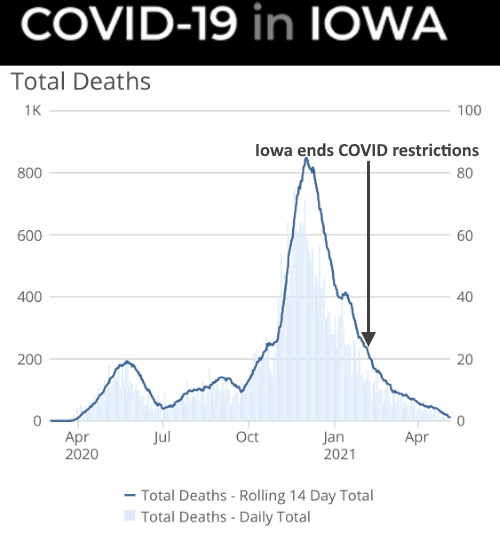
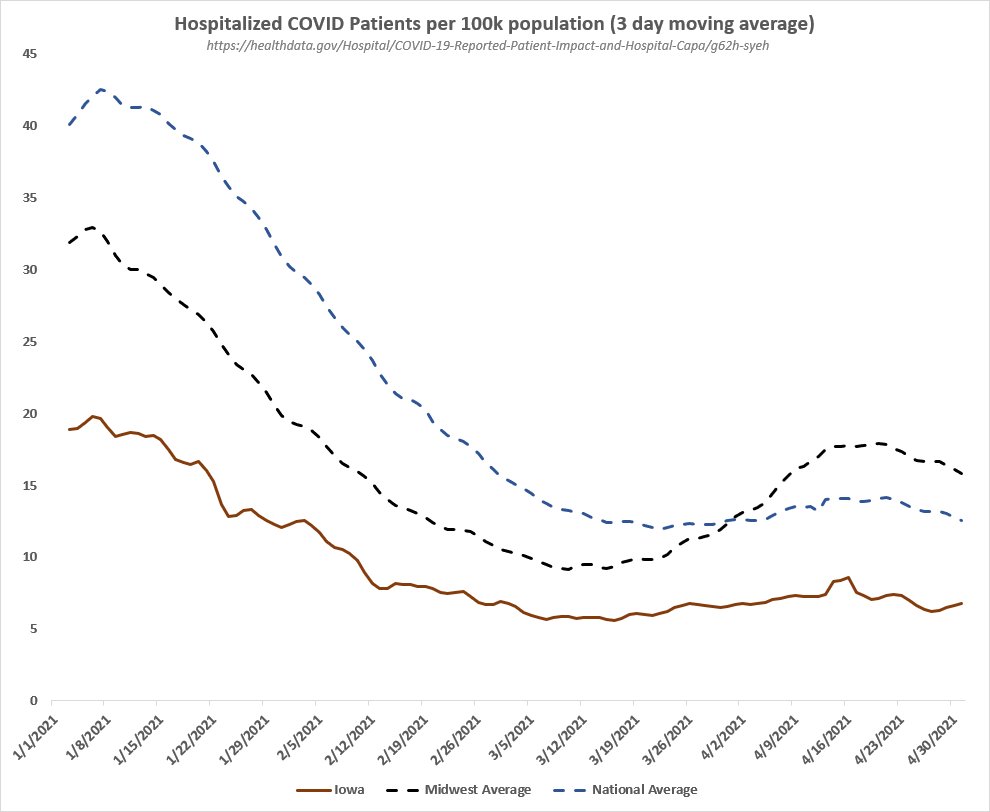
1/ 3 months ago today, Iowa ended all COVID restrictions. As you can see, it turned out to be a complete disaster, as all the replies in the thread below predicted.
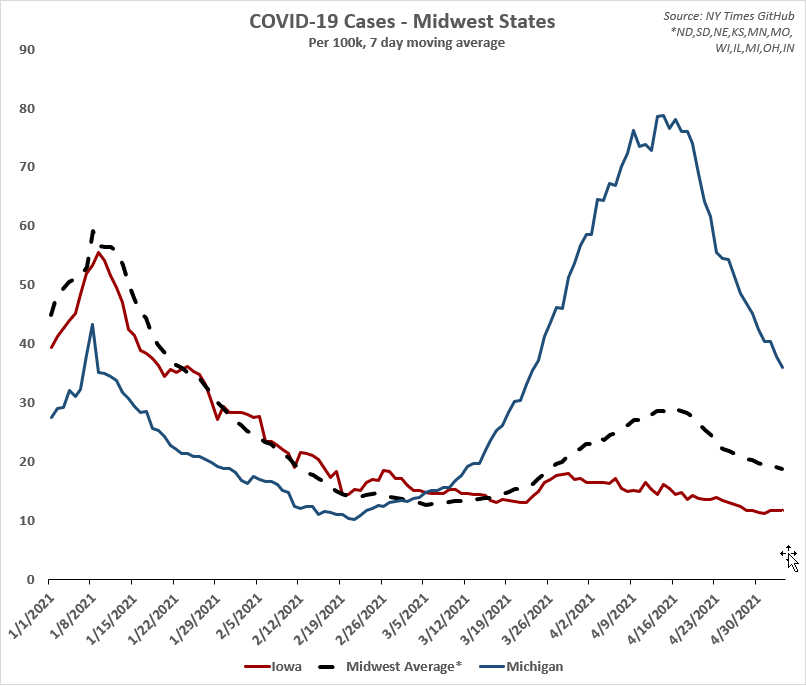
2/ Compared to its neighbors, Iowa's 7 day average of daily cases has actually diverted and become lower than the Midwest average, and was spared a large spring wave seen in stricter states like Michigan.
3/ "But what if they're not testing enough?" I'm sure some would say. Seems like the other side of the same coin of the Trump "you don't find cases if you don't test" argument, but here are hospitalizations instead, compared to the midwest and national average. Still better.
Read 16 tweets
6 May
I took population-normalized COVID hospitalizations for the 25 most stringent states on COVID policy in the US (red line), and compared them to the 25 least stringent states (blue line). Trajectory is nearly identical. Both had the same average inpatients per day - 23 per 100k.
Hospitalizations peaked for the less-stringent states January 6th, and for the more-stringent states January 7th. Pretty remarkable.
Read 4 tweets
16 Mar
In September 2019, Johns Hopkins in partnership with WHO published a detailed report on "high-impact respiratory pathogens" that is prophetic. For example, they warned NPI policies could be abused by overreaching governments for political/social purposes, not because of evidence.
They say widespread quarantine is likely the least effective NPI to do anything, especially if the pathogen is a) airborne, b) highly transmissible. Sound familiar? They mention how the Ebola experience highlights how difficult quarantine policies can be to maintain.
They urge that every NPI that is considered must also consider any potential harms that could come from the intervention - seeing that it's well-documented that lockdowns essentially do nothing, we are left with assessing the harms of them, which will be seen for decades to come.
Read 6 tweets
1 Mar
Thanks to an FOIA request from a determined friend here in KC, we now know the number of #COVID19 cases the Kansas City Health Department could trace from restaurants and bars between November 1st and January 31st.

The answer is 11.
2/ In addition to the extraordinarily weak contact tracing data from KCHD, the timeline and mobility data does not align at all with their narrative that these businesses have a meaningful impact on community spread. ericjusteric.medium.com/in-support-of-…
3/ Despite this, they credit "contact tracing 20-29 year olds" as well as 10 PM stoppage of indoor dining/drinking for the decrease in cases in KC, although once again the data does not align with these claims at all.
Read 4 tweets
17 Feb
Narrative: "COVID cases are going down because more people are staying home!"

Reality: According to the USC Dornsife "Understanding America" study, the percentage of people in the US staying home except for essential activities/exercise has remained around 40-45% since June
Narrative: "COVID cases are going down because less people are gathering at each others' homes!"

Reality: The percentage of people in the US that have had visitors at their residence has remained between roughly 40 and 50% since May
Narrative: "COVID cases are going down because more people are wearing masks!"

Reality: The percentage of people in the US that have worn masks has remained around 90-93% since July
Read 4 tweets

Did Thread Reader help you today?

Support us! We are indie developers!


This site is made by just two indie developers on a laptop doing marketing, support and development! Read more about the story.

Become a Premium Member ($3/month or $30/year) and get exclusive features!

Become Premium

Too expensive? Make a small donation by buying us coffee ($5) or help with server cost ($10)

Donate via Paypal Become our Patreon

Thank you for your support!

Follow Us on Twitter!

:(