This is a perfectly reasonable question. #VaccinesWork and the UK vaccination effort has been incredible, so why do so many people, including me, feel that unlocking on June 21 is just too much of a risk right now? 🧵 (TLDR: Delta/India variant, cases 📈)
With the delta variant now prevalent in the UK, cases are rising exponentially, doubling around every 9 days. I like the way @BristOliver presents these... follow the line to see where the current trajectory takes us. 2/12
As @theJeremyVine notes, vaccines have dramatically reduced the proportion of cases that turn into hospital admissions and deaths. Whilst I’m mindful of concerns around long covid, it’s these more immediate outcomes that underlie the roadmap. I’ll focus on those today. 3/12
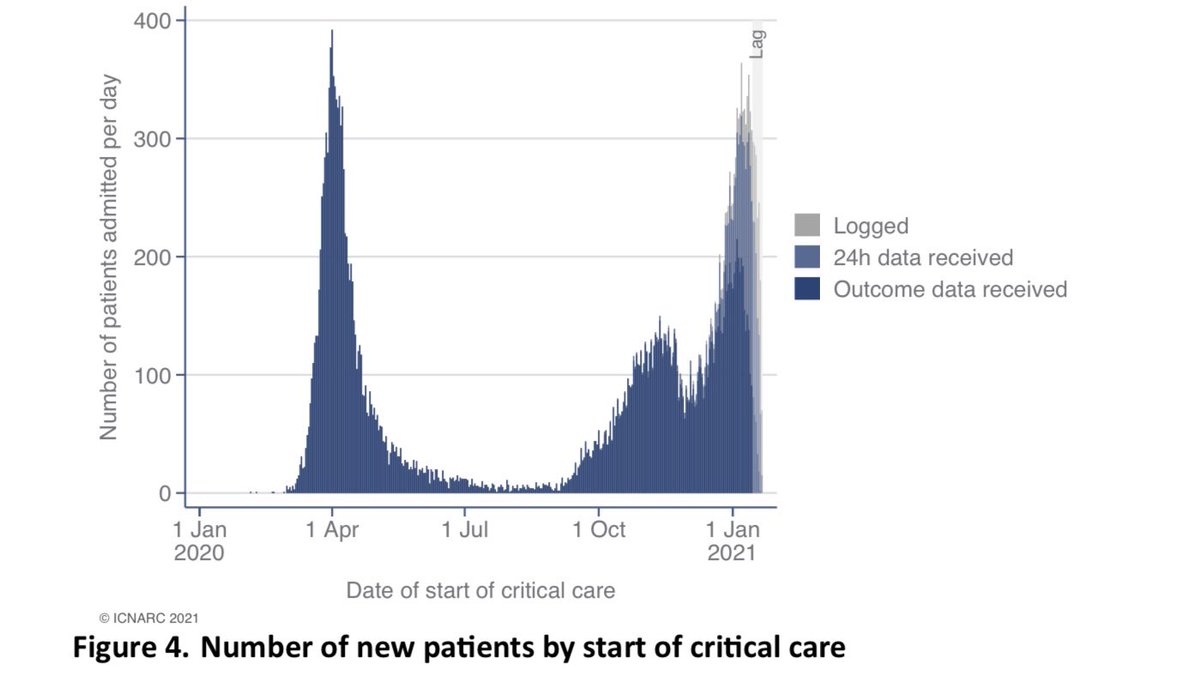
Hospital admissions are rising, highlighted yesterday by @COVID19actuary. To date, growth is much slower than for cases. We need to watch this closely over the next couple of weeks to see where it goes. We just won’t have enough data in time for the 21 June decision. 4/12
The UK’s vaccination push has been incredible, and all involved should be proud. Nonetheless, 3 out of 5 people remain either unvaccinated or only partially vaccinated (just one dose, or received second very recently). 5/12
The vaccines are great but they are not perfect, particularly against the delta variant. Even if there is 70% protection from one dose and 95% protection from two that has the potential to result in another large wave of hospital admissions and deaths. 6/12
How bad could things get? A well-explained model is the public domain is this by @JamesWard73.

The scenarios below show just how uncertain the current situation is. A huge exit wave of hospitalisations is by no means certain, but in my view the risk is currently too high. 7/12
So what can we do? With exponential growth apparent the national policy discussion should consider:
- more restrictions
- stay as we are
- relax restrictions as planned.

Based on the data and modelling I’ve seen I would favour staying as we are for a couple more weeks. 8/12
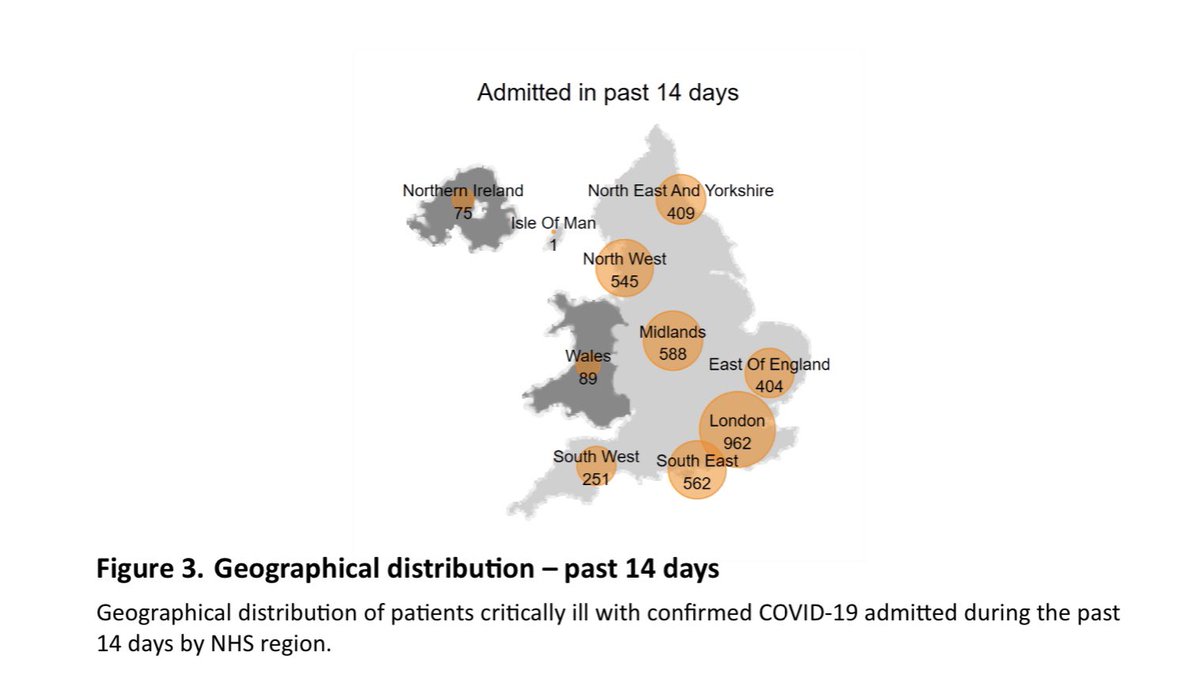
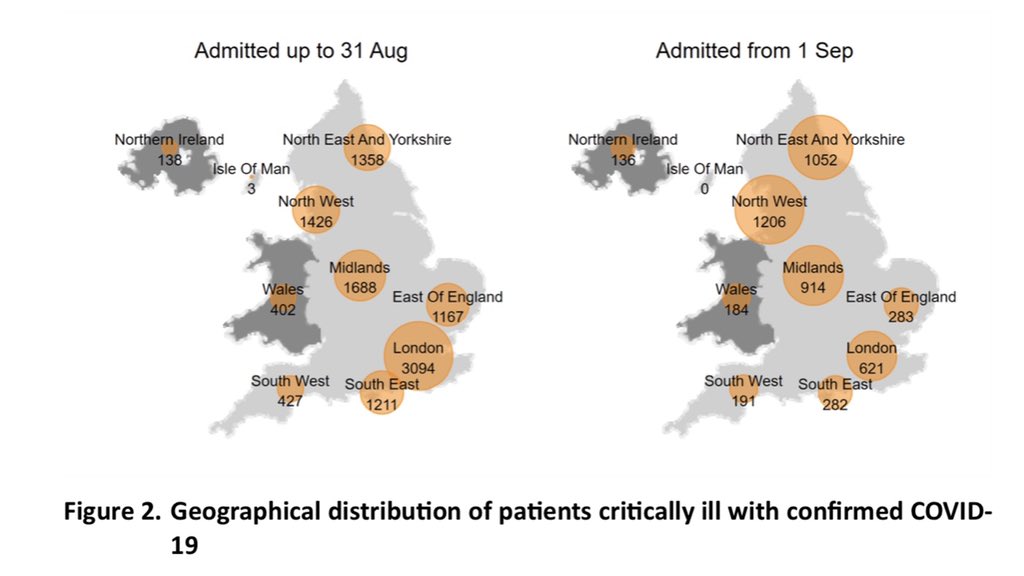
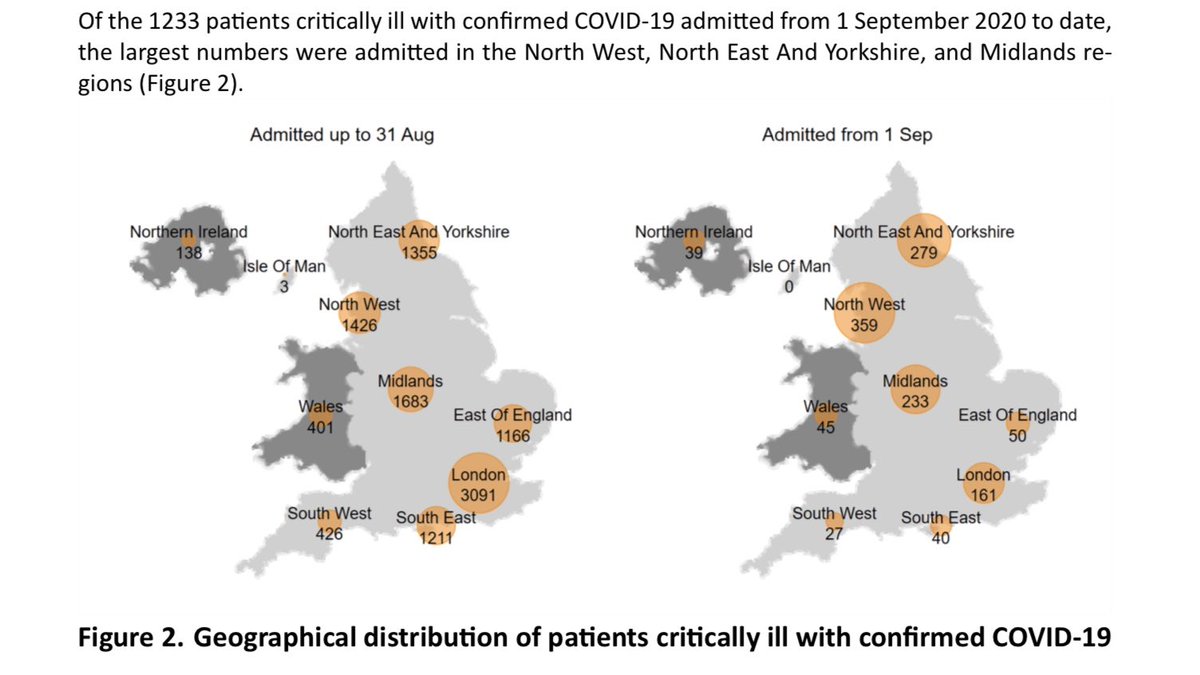
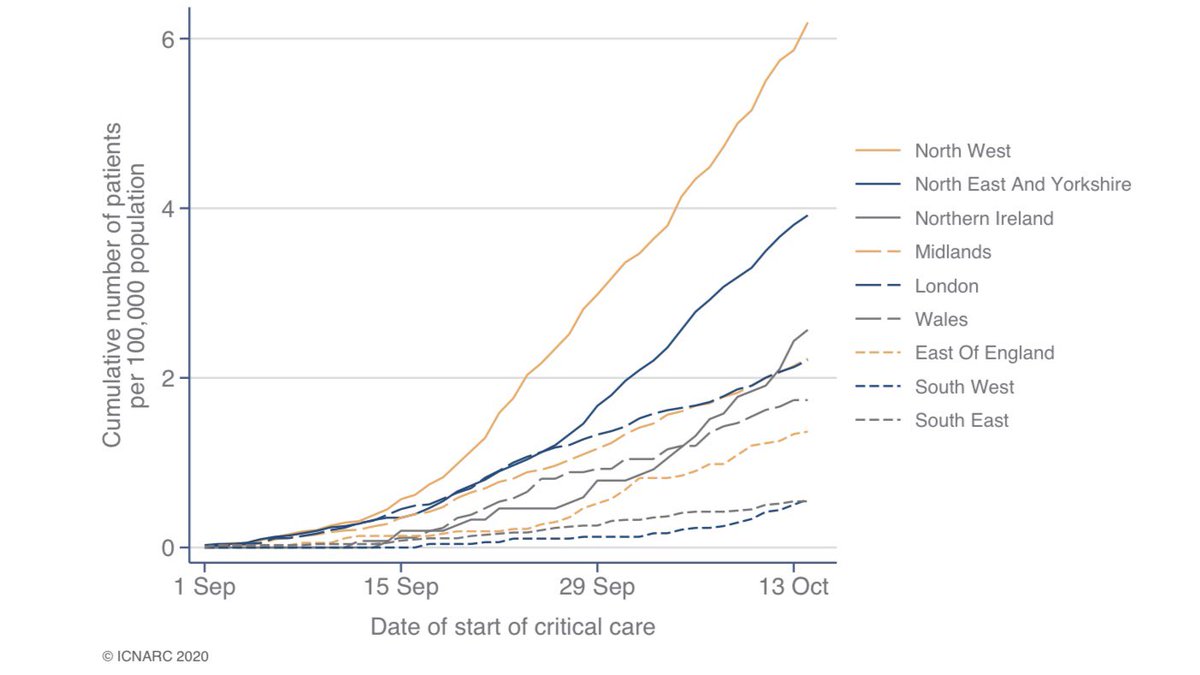
Of course more local measures should be discussed given the clear difference between the North West and other parts of the country, but we shouldn’t kid ourselves that the NW situation is unique - they are just ahead of the curve. 9/12
The roadmap out of lockdown has, in my view been a great success. #DataNotDates approach has brought us to a position where hospital numbers and deaths are low, despite the delta variant. We need to be true to that approach and hit the pause button for a couple of weeks. 10/12
As individuals we need to continue to follow the guidance and keep numbers meeting indoors low. Crucially, we need to get the jab as soon as we can. Over 25s can book first jab and over 40s waiting 11-12 weeks for their second AZ jab can bring the date forward here👇. 11/12
In summary then:
- #VaccinesWork and are saving lives - get both jabs!
- I don’t think more national measures currently needed but we can’t risk opening on 21 June. Tests 3 and 4 are currently questionable.
- Hospital data should be clearer in a couple of weeks.

Stay safe! 12/12
I’ve consolidated the thread into a blogpost here, addressing a couple of comments received tab the same time.
covid-arg.com/post/when-to-t…

• • •

Missing some Tweet in this thread? You can try to force a refresh
 

Keep Current with stuart mcdonald

stuart mcdonald Profile picture

Stay in touch and get notified when new unrolls are available from this author!

Read all threads

This Thread may be Removed Anytime!

PDF

Twitter may remove this content at anytime! Save it as PDF for later use!

Try unrolling a thread yourself!

how to unroll video
  1. Follow @ThreadReaderApp to mention us!

  2. From a Twitter thread mention us with a keyword "unroll"
@threadreaderapp unroll

Practice here first or read more on our help page!

More from @ActuaryByDay

8 Jun
Latest ONS deaths data (to week ending 28 May) has been released.

312 fewer deaths were recorded in-week compared to the 2015-19 year average. That’s 3% lower.

Year to date there have been 259,829 deaths recorded, which is 10% higher than the 2015-19 average. Image
There are 95 deaths where COVID was mentioned on the death certificate this week. 74% of the deaths with COVID mentioned had it listed as as underlying cause.
As with last week, when @john_actuary provided this update (thanks John!) we have another “clean” week without bank holiday distortions this year or the 2015-19 average. And, like last week, 2021 death counts are 3% below the 2015-19 average.
Read 5 tweets
27 Mar
Oh dear! I thought for a moment this account had been hacked, but it turns out I just haven’t been paying attention.

Disappointing to see this sort of misinformation from someone who should know better.

Let’s do some basic maths, something which seems to have escaped Helena.
Do we need to see people “dropping dead in the street” to be in a pandemic? Absolutely not!

A projection of the impact of an *unmitigated* spread of the virus was a UK death toll of around half a million deaths. That’s *roughly* the same number as die each year normally.
The age distribution of COVID-19 deaths is *roughly* the same as the ordinary distribution of deaths which allows us to do a simple rule of thumb. If we had completely let things get out of control then we would each have seen one COVID death for each death we normally see.
Read 9 tweets
23 Jan
Latest @ICNARC report on intensive care admissions and outcomes has been published.

17,015 patients have been admitted to ICU so far in the second wave, significantly more than the 10,938 in the first wave.

Short thread, with full report linked below.
In the last two weeks, ICU admissions have been high in most parts of England, especially London and surrounding areas.
Figure 16 illustrates the average daily number of patients in ICU for any reason in each month for the last five years.

This clearly shows that there were far more patients than normal in April, November and December 2020
Read 10 tweets
27 Dec 20
@hughosmond @COVID19actuary Yes, non-COVID deaths have been below expected levels since late May. The shortfall is increasing as we approach the usual winter peak. This suggests that a fair number of those who died in April / May would have been unlikely to survive this winter. We can estimate how many...
@hughosmond @COVID19actuary CMI reported 63,500 excess deaths to week 24 (mid June). This fell through summer and had risen again during the second wave, reaching 70,300 excess deaths to 11 December.

So excess deaths increased by 6,800 despite 23,600 additional COVID deaths. A “shortfall” of 16,800 deaths.
@hughosmond @COVID19actuary This suggests that around one quarter of those who died during the initial peak might have died by now of other causes. That is far fewer than some were suggesting at the time (there was talk of it being a majority, which actuaries were quick to challenge).
Read 7 tweets
21 Nov 20
The latest @ICNARC intensive care weekly report has been published. A short thread to summarise, including a link to the full report.

The report covers critical care admissions to 20 November and compares the second wave (1 Sep onwards) to the first. 1/9
The report now covers 4,869 patients from 1 September. Critical care outcomes are reported for 3,293 of these patients.

Most second wave admissions in the North of England and the Midlands. Interesting to compare and contrast locations with first wave. 2/9
Figure 13 compare all pneumonia admissions in recent years to 2020 (with this years admissions split between COVID and other). It’s clear that relevant admissions this year (orange plus blue lines) are many times higher than normal in both the first and second waves. 3/9
Read 9 tweets
17 Oct 20
The latest @ICNARC intensive care weekly report has been published. A short thread to summarise, including a link to the full report. The report covers critical care admissions to 15 October and compares the second wave (1 Sep onwards) to the first. 1/10
The report now covers 1,233 patients from 1 September. Of these, 643 have outcomes reported and 590 are still receiving critical care.

Most admissions in the North of England and the Midlands. However, allowing for size of local population N. Ireland and London look bad. 2/10
Table 1 summarises patient characteristics, showing how these compare with the first wave.

As before, seven out of ten ICU admissions are males, with most aged 50-80. 3/10
Read 10 tweets

Did Thread Reader help you today?

Support us! We are indie developers!


This site is made by just two indie developers on a laptop doing marketing, support and development! Read more about the story.

Become a Premium Member ($3/month or $30/year) and get exclusive features!

Become Premium

Too expensive? Make a small donation by buying us coffee ($5) or help with server cost ($10)

Donate via Paypal Become our Patreon

Thank you for your support!

Follow Us on Twitter!

:(