Fibonacci Retracement 📚
One of the most effective tools for profitable trading everyone must know.
▪️ What is it?
▪️ Why are they such a powerful tool?
▪️ How to properly use them?
▪️ Hot to define strong trends?
▪️ Advanced techniques?
1/16
One of the most effective tools for profitable trading everyone must know.
▪️ What is it?
▪️ Why are they such a powerful tool?
▪️ How to properly use them?
▪️ Hot to define strong trends?
▪️ Advanced techniques?
1/16
▪️ What is it?
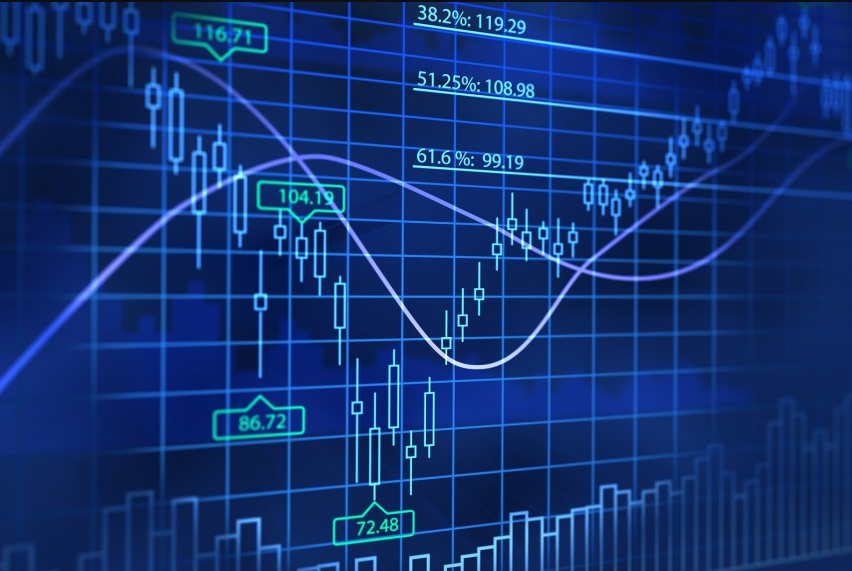
Fibonacci retracement levels are horizontal lines that indicate where Support & Resistance are likely to occur
They are based on Fibonacci numbers. Each level is associated with a percentage. The percentage is how much of a prior move the price has retraced
2/16
Fibonacci retracement levels are horizontal lines that indicate where Support & Resistance are likely to occur
They are based on Fibonacci numbers. Each level is associated with a percentage. The percentage is how much of a prior move the price has retraced
2/16

The most commonly used ratios include 23.6%, 38.2%, 50%, 61.8%, and 78.6%. Although you can modify them and put any number you find the most valuable for you.
In simple words, they are nothing more than a % retracement from two price points.
3/16
In simple words, they are nothing more than a % retracement from two price points.
3/16

▪️ Why are they such a powerful tool?
Because they define very clear horizontal levels where the price is the most likely to:
1) React
2) Could pullback to
3) Is most likely to bottom
It's also the best tool to DCA in on dips in a trend
4/16
Because they define very clear horizontal levels where the price is the most likely to:
1) React
2) Could pullback to
3) Is most likely to bottom
It's also the best tool to DCA in on dips in a trend
4/16

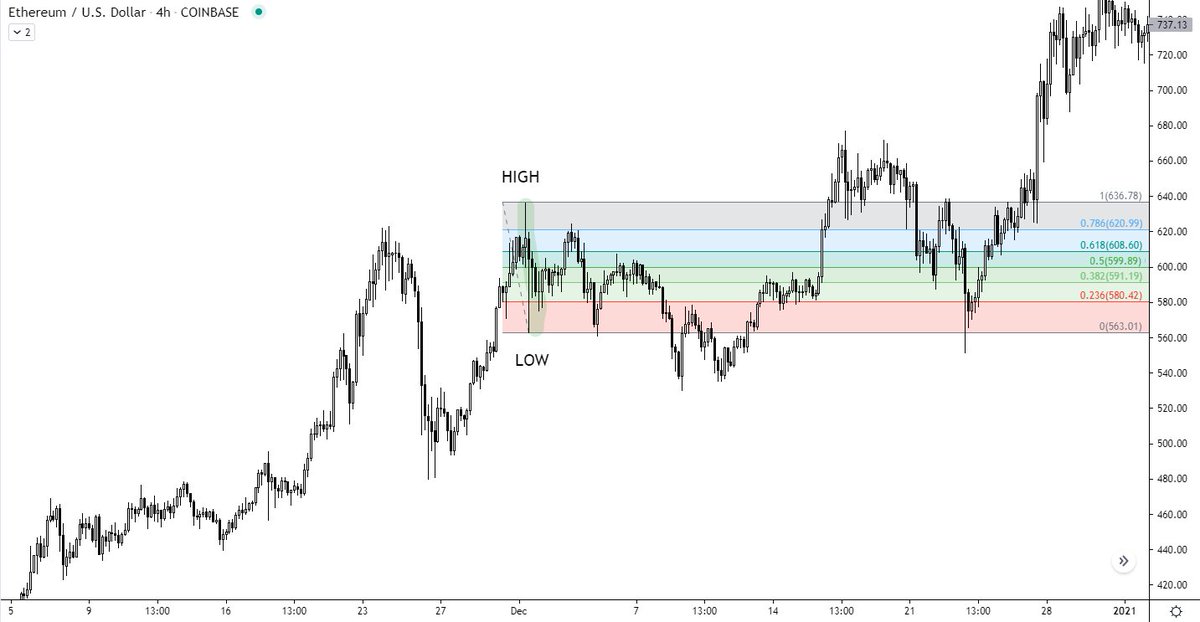
▪️ How to properly use them?
In order to properly draw Fibs, you must understand what swings are, if you don't, read below 👇
Once you do, you drag them from the low to the high or vice versa and look for reactions on the retracement levels
5/16
In order to properly draw Fibs, you must understand what swings are, if you don't, read below 👇
Once you do, you drag them from the low to the high or vice versa and look for reactions on the retracement levels
5/16
https://twitter.com/jackis_trader/status/1285221405932609536


What u must understand is that each swing at each timeframe has its own little retracements and you must always remember that the bigger the timeframe the bigger the relevance.
This is a nice example of many smaller swings inside of one big
6/16
This is a nice example of many smaller swings inside of one big
6/16


In the example above us, you can see many bearish swings with nice little retracements in between but it is truly important to keep in mind that we are still inside of this one HTF swing in a dominant bullish trend.
That's where most traders do the most mistakes...
7/16
That's where most traders do the most mistakes...
7/16

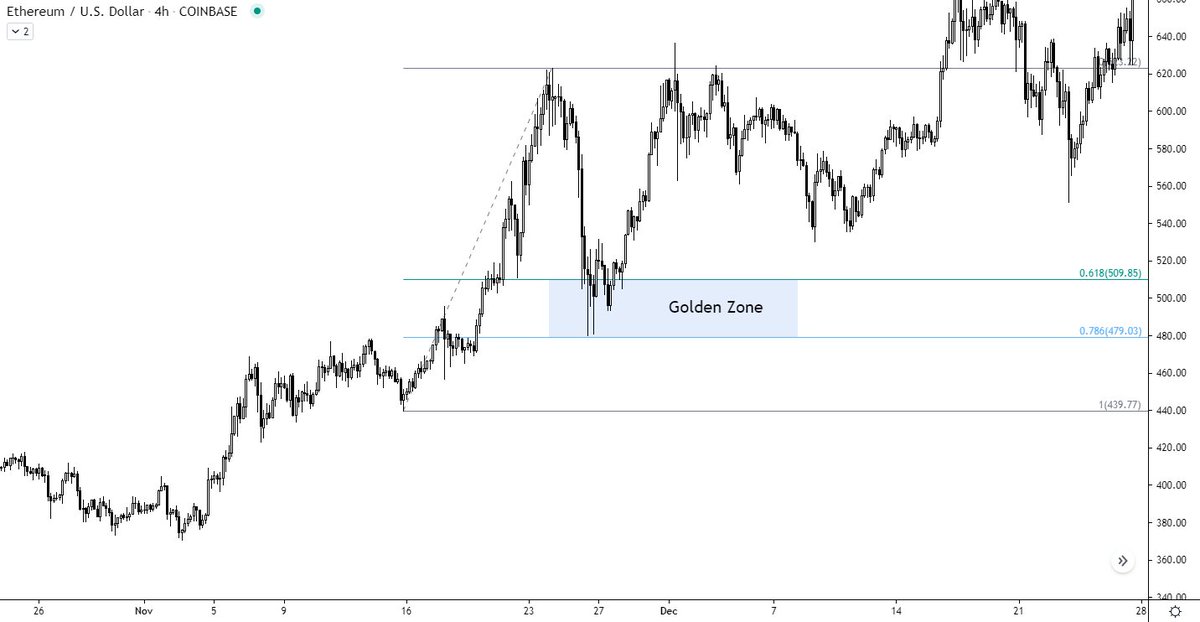
...because they think the price is going down as they are stuck on the H1 timeframe but in reality, it's just a healthy HTF retracement right into the "Golden Zone"
The GZ is anything between the magical 61.8% & 78.6% retracement
That's where you place your bids
8/16
The GZ is anything between the magical 61.8% & 78.6% retracement
That's where you place your bids
8/16

After the new swing appears we have to adjust our fib & always be mindful between the HTF & LTF swings & the dominant HTF trend.
If you add the advanced principles of MS, see below 👇, then you have the perfect formula
9/16
If you add the advanced principles of MS, see below 👇, then you have the perfect formula
https://twitter.com/jackis_trader/status/1280130845030965250
9/16

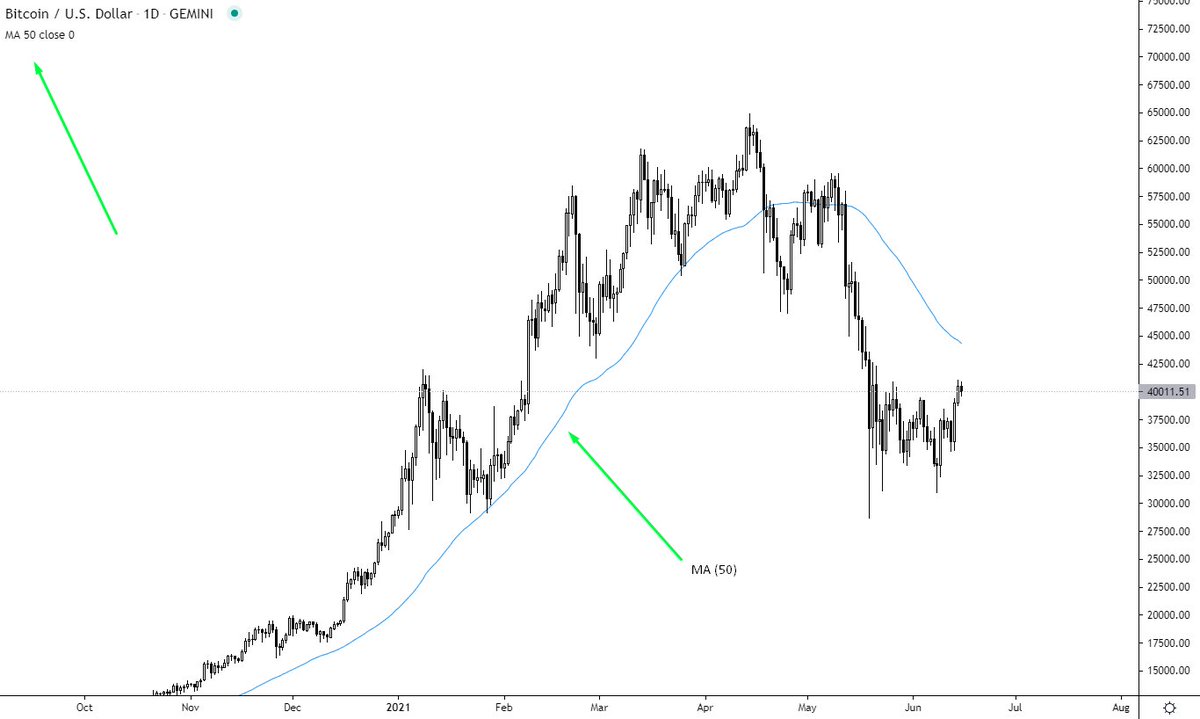
▪️ Hot to define strong trends?
You mark the significant low on the chart and keep updating your point high level as the price moves higher but keeping the same low you drag your fib from
In a strong trend, price shouldn't be retracing to the 50% level
10/16
You mark the significant low on the chart and keep updating your point high level as the price moves higher but keeping the same low you drag your fib from
In a strong trend, price shouldn't be retracing to the 50% level
10/16

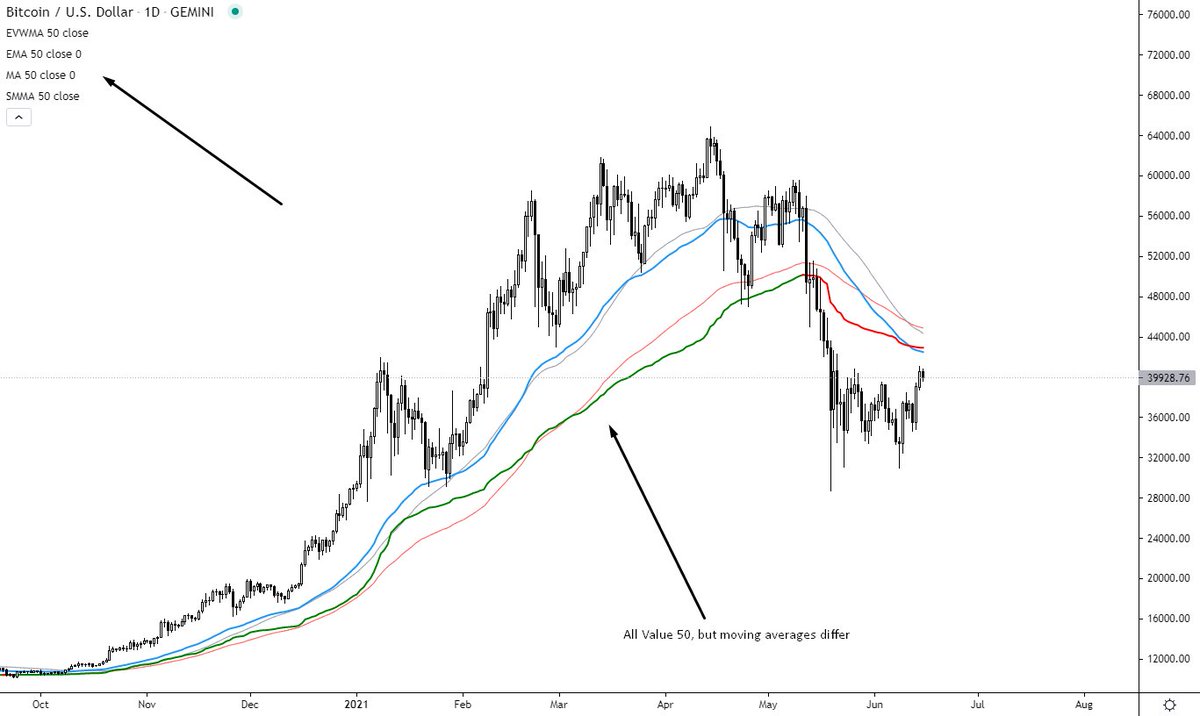
Price moves higher you update the fib high.
Any retracement to the 23,6% & 38,2% is a level to watch for continuation. DCA at these levels is the smartest move.
If the price retraces & closes below the 50% level. The trend could be temporarily paused for a HTF pullback.
11/16
Any retracement to the 23,6% & 38,2% is a level to watch for continuation. DCA at these levels is the smartest move.
If the price retraces & closes below the 50% level. The trend could be temporarily paused for a HTF pullback.
11/16


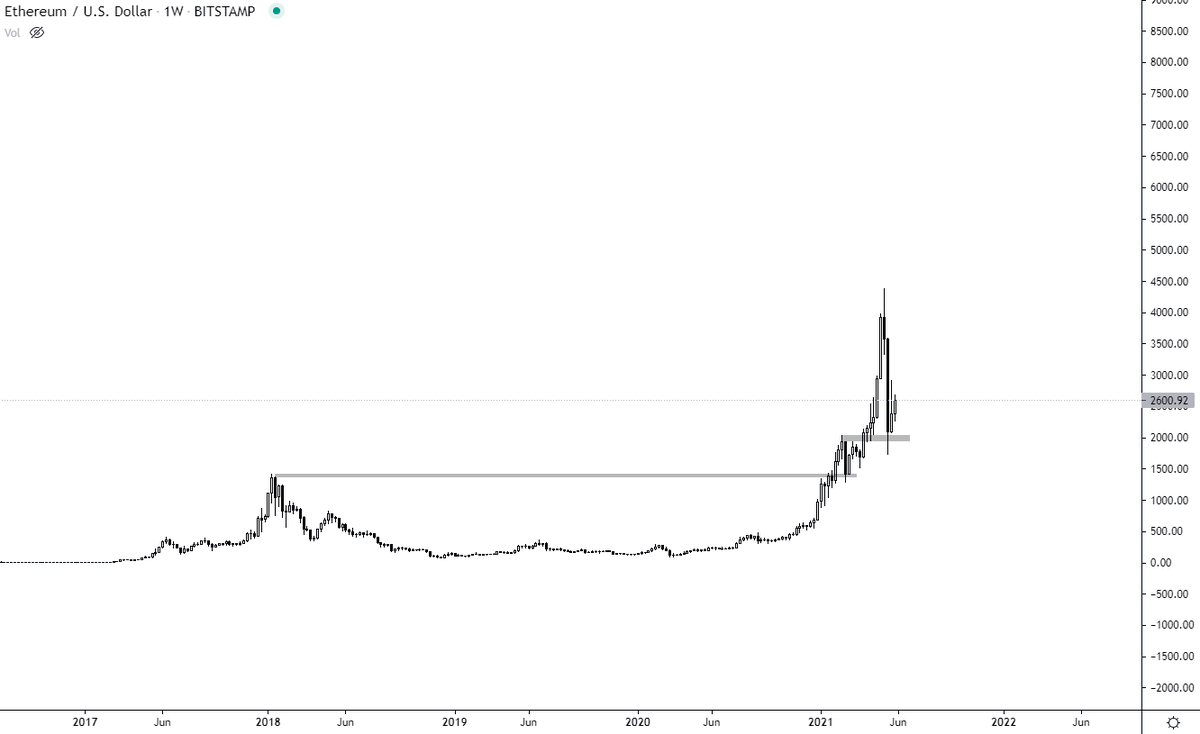
A nice example of this was also the #Bitcoin 2017 run where price kept bouncing out of the 23,6% & 38,2% levels until it didn't & closed below 50%
Price did its HTF retest of the golden zone and continued trading upwards.
12/16
Price did its HTF retest of the golden zone and continued trading upwards.
12/16


▪️ Advanced techniques?
Use both methods we just learned and combine them.
Apply the HTF 23,6% & 38,2% levels with LTF swing retracement levels of Golden Zone (GZ)
13/16
Use both methods we just learned and combine them.
Apply the HTF 23,6% & 38,2% levels with LTF swing retracement levels of Golden Zone (GZ)
13/16

Where you find confluence with the LTF Golden Zone (GZ) & HTF trend continuation levels you place your bids.
You see how very easy it can get. And if you miss the first opportunity, you can always re-enter later on another retracement.
14/16
You see how very easy it can get. And if you miss the first opportunity, you can always re-enter later on another retracement.
14/16

The thing to remember is to always try to connect the significant swings that really stick to your eye if you are unsure.
You can also switch between lower & higher timeframes to get a better idea of the swing.
Unclear which low to use? Switch from D1 to W1
15/16
You can also switch between lower & higher timeframes to get a better idea of the swing.
Unclear which low to use? Switch from D1 to W1
15/16


Hopefully, you found this thread valuable once again & it's gonna increase your probability and profitability in the markets
If you did, please consider liking & sharing it with your friends. It's gonna help me create more of these threads & your friends to get better 🙌
16/16
If you did, please consider liking & sharing it with your friends. It's gonna help me create more of these threads & your friends to get better 🙌
16/16
• • •
Missing some Tweet in this thread? You can try to
force a refresh