TODAY’S (6月21日) #COVID19 update for #Taiwan 🇹🇼
📉75 local + 0 imported cases 📉trend
📉20 deaths 📈trend
📈0.6% test positive rate
📈4.2% case fatality rate (CFR) since May 1
🧪13k tests ⤵️capacity
⚠️It's Monday. Numbers of tests and their positive rates are key metrics. ⬇️ 1/6
DAILY CASES REPORTED (pink bars) and their 7-DAY AVERAGE (pink line), where each day is the mean of itself and the previous six. DEATHS (crimson red bars) at the bottom. THRILLED to have room for the chart legend specifically in the top right quadrant! 2/6
AGE DISTRIBUTION OF CASES. Local cases from May 1-June 20 (age data for cases lag by a day), including those with missing locations. Only a single category is provided for ages >70, which constitute 14% of all cases. DATA ➡️ data.cdc.gov.tw/en/dataset/ags… 3/6
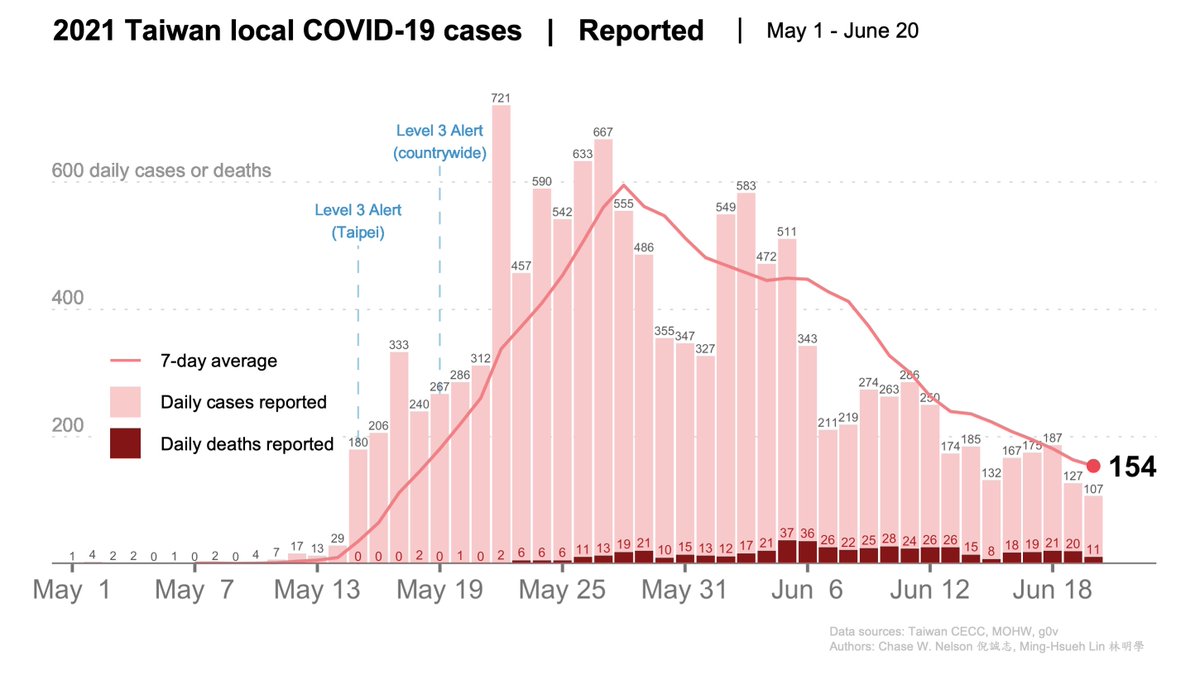
TODAY’S (6月20日) #COVID19 update for #Taiwan 🇹🇼
📉107 local + 2 imported cases 📉trend
📉11 deaths 📉trend
📈0.6% test positive rate
📈4.1% case fatality rate (CFR) since May 1
🧪20k tests ⤵️capacity
⚠️Fewer cases BUT many fewer tests, higher positivity, and higher CFR. ⬇️ 1/6
DAILY CASES REPORTED (pink bars) and their 7-DAY AVERAGE (pink line), where each day is the mean of itself and the previous six. DEATHS (crimson red bars) at the bottom.
AGE DISTRIBUTION OF DEATHS for May 1-June 20:
🔴64% are ≥70
🔴26% are 60-69
🔴10% are 30-59 years 2/6
AGE DISTRIBUTION OF CASES. Local cases from May 1-June 19 (age data for cases lag by a day), including those with missing locations. Only a single category is provided for ages >70, which constitute 14% of all cases. DATA ➡️ data.cdc.gov.tw/en/dataset/ags… 3/6
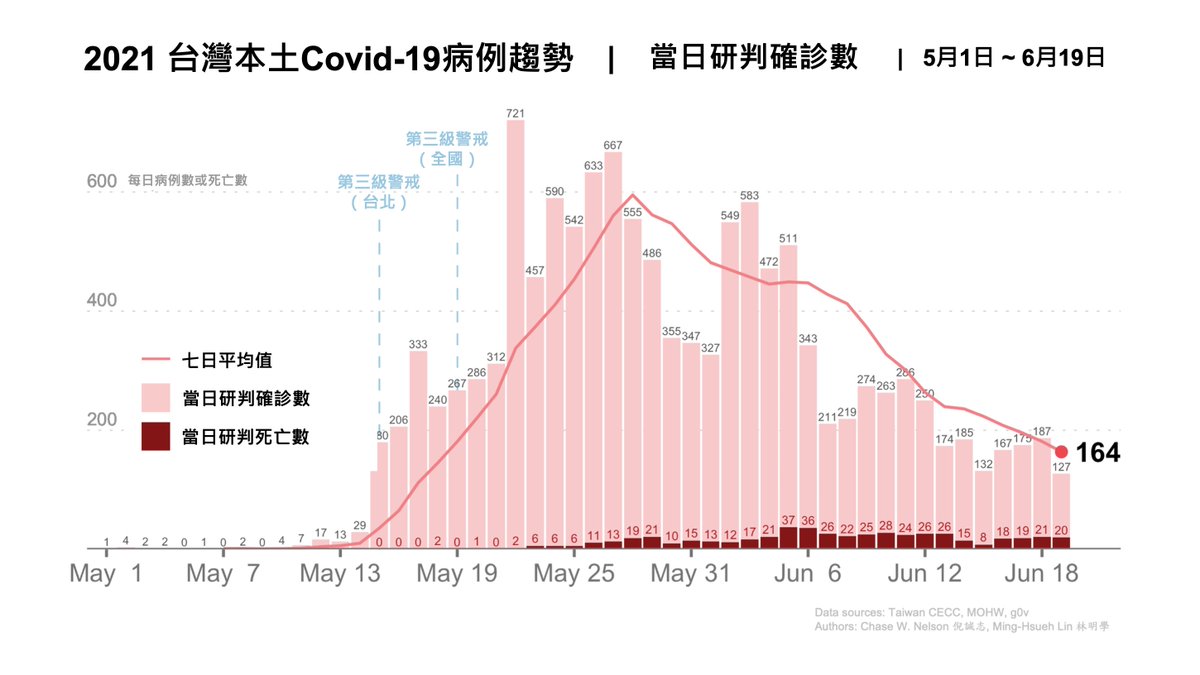
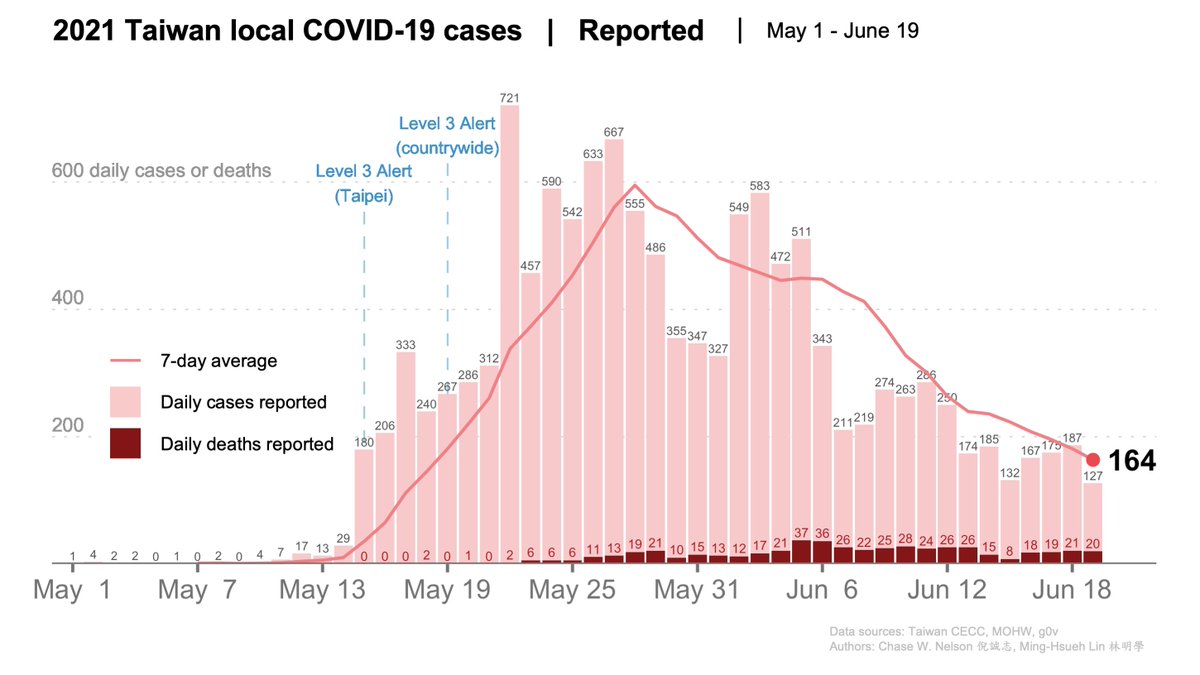
TODAY’S (6月19日) #COVID19 update for #Taiwan 🇹🇼
📉127 local + 1 imported cases 📉trend
📉20 deaths 📉trend
📉0.3% test positive rate
📈4.0% case fatality rate (CFR) since May 1
🧪36k tests ⤵️trend
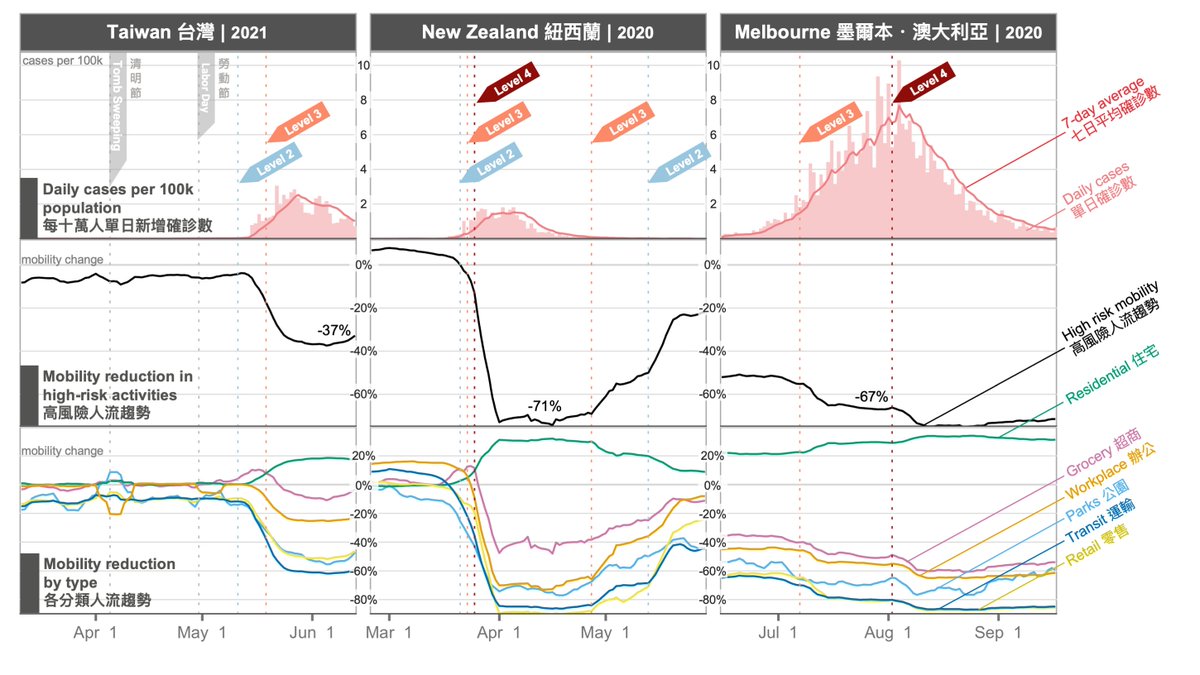
⚠️WORKPLACE MOBILITY remains HIGHER than other outbreak-halting countries ⬇️ 1/6
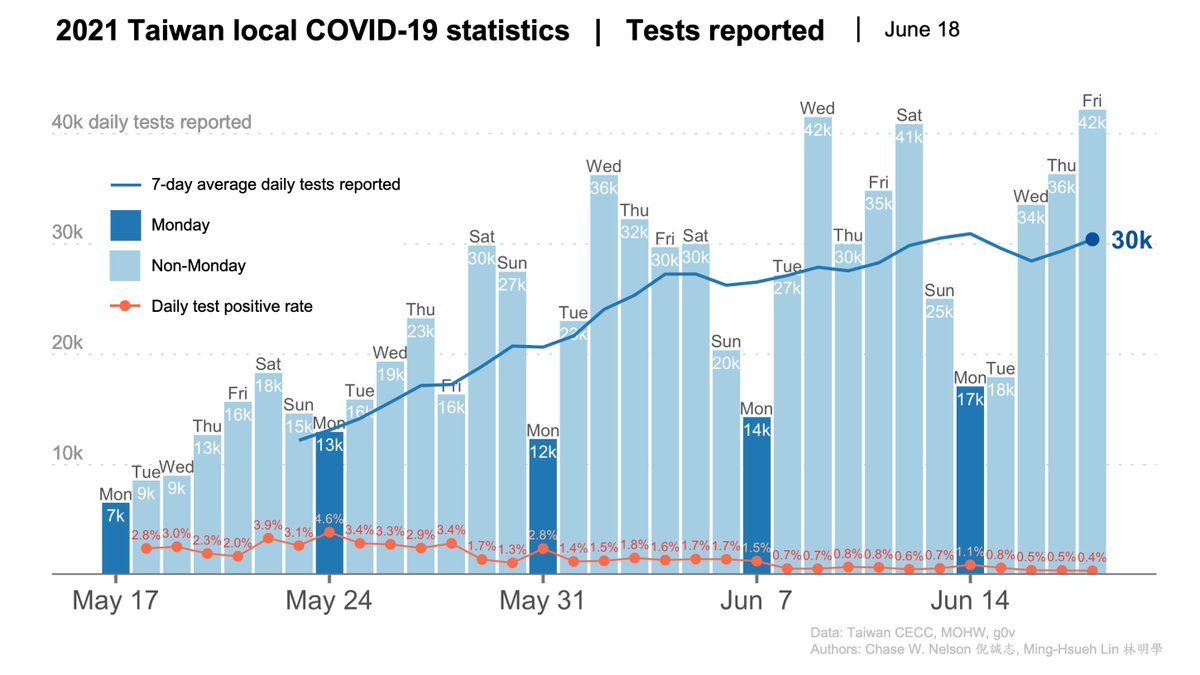
DAILY TESTS REPORTED. Daily counts are subject to bias, with the fewest tests consistently reported on Mondays. This emphasizes the importance of 7-day averages, not daily values. The mean seems to be slowly rising, even though today's mean dipped. 2/6
DAILY CASES REPORTED (pink bars) and their 7-DAY AVERAGE (pink line), where each day is the mean of itself and the previous six. DEATHS (crimson red bars) are seen at the bottom.
DEATHS AGE DISTRIBUTION for May 1-June 19:
🔴64% are ≥70
🔴26% are 60-69
🔴10% are 30-59 years 3/6
TODAY’S (6月18日) #COVID19 update for #Taiwan 🇹🇼
📈187 local + 1 imported cases 📉trend
📈21 deaths 📉trend
📉0.4% test positive rate
📈3.9% case fatality rate (CFR) since May 1
🧪42k tests 📈capacity
💡Good to see a record high tests (42.2k) and record low positivity (0.4%). 1/6
DAILY CASES REPORTED (pink bars) and their 7-DAY AVERAGE (pink line), where each day is the mean of itself and the previous six. DEATHS (crimson red bars) are seen at the bottom.
DEATHS AGE DISTRIBUTION for May 1-June 18:
🔴64% are ≥70
🔴26% are 60-69
🔴10% are 30-59 years 2/6
AGE DISTRIBUTION OF CASES. Local cases from May 1-June 17 (age data for cases lag by a day), including those with missing locations. Only a single category is provided for ages >70, which constitute 14% of all cases.
DATA ➡️ data.cdc.gov.tw/en/dataset/ags… 3/6
TODAY’S (6月17日) #COVID19 update for #Taiwan 🇹🇼
📈175 local + 0 imported cases 📉trend
📈19 deaths 📉trend
📉0.5% test positive rate
📈3.8% case fatality rate (CFR) since May 1
🧪36k tests 📈capacity
💡Good to see concurrent downward trends in cases, deaths, and positivity. 1/6
DAILY CASES REPORTED (pink bars) and their 7-DAY AVERAGE (pink line), where each day is the mean of itself and the previous six. Reported DEATHS (crimson red bars) are seen at the bottom. For deaths from May 1-June 17:
🔴64% are ≥70
🔴26% are 60-69
🔴10% are 30-59 years old 2/6
AGE DISTRIBUTION OF CASES. Local cases from May 1-June 16 (age data for cases lag by a day), including those with missing locations. Only a single category is provided for ages >70, which constitute 14% of all cases. ➡️data.cdc.gov.tw/en/dataset/ags… 3/6