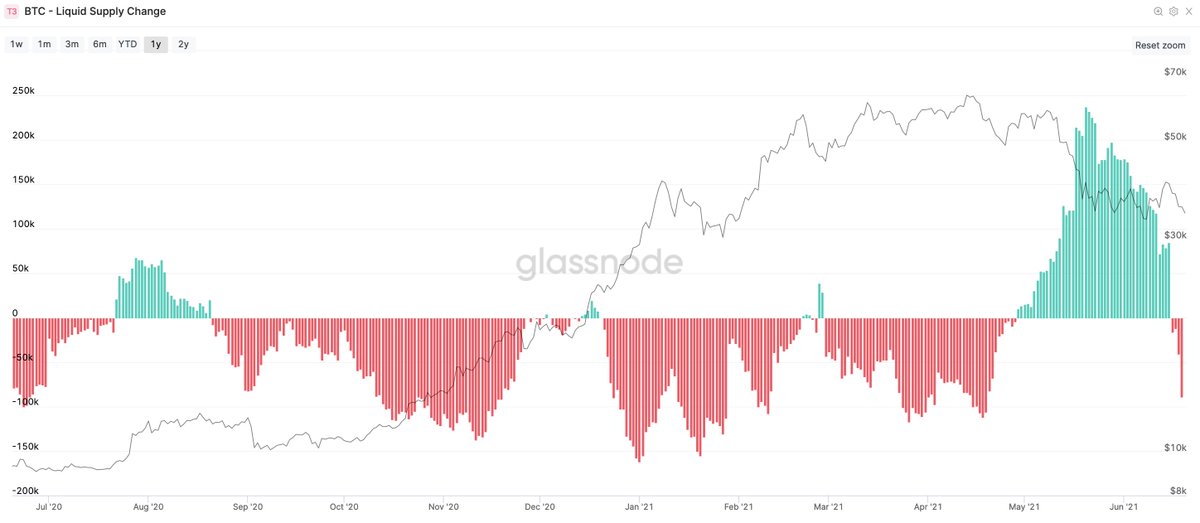
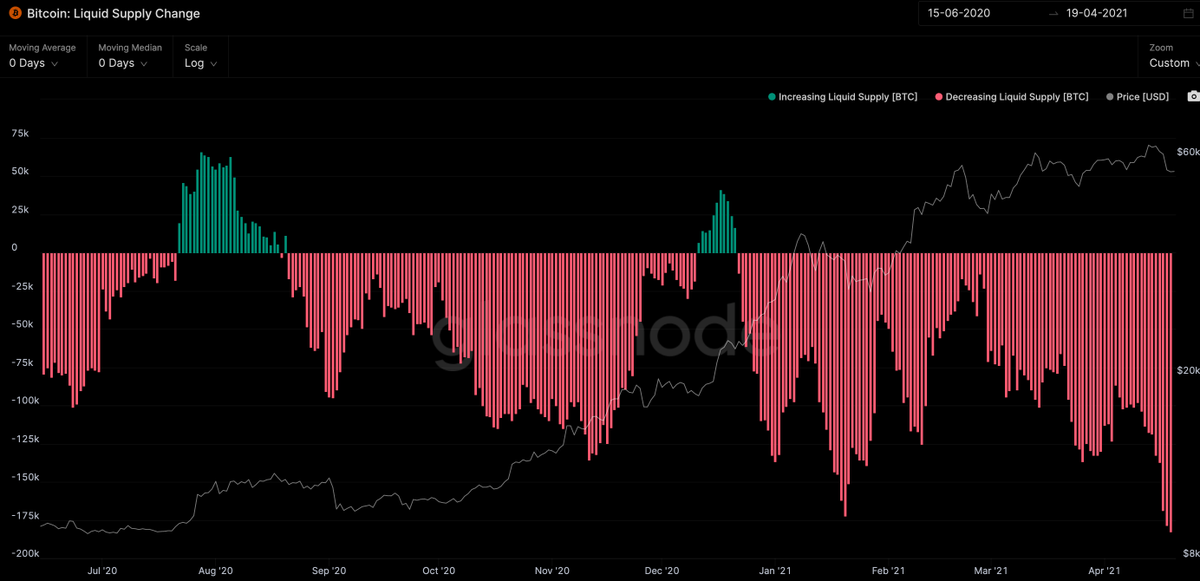
Oh my, Rick Astley is back. Coins are moving back to the HODLer who never deserts his BTC.
The previous chart was a 30 day sum of coin movements.
Here's the 7 day view showing greater granularity.
We can see how the mass of coins dumped out to speculative hands are being re-accumulated by strong hands in a pattern similar to the COVID recovery (8 weeks to recover).
Crabs are stacking as hard as their little shells will let them.
Shrimps are taking their lead and stacking like there's no tomorrow, especially in the latest dip.
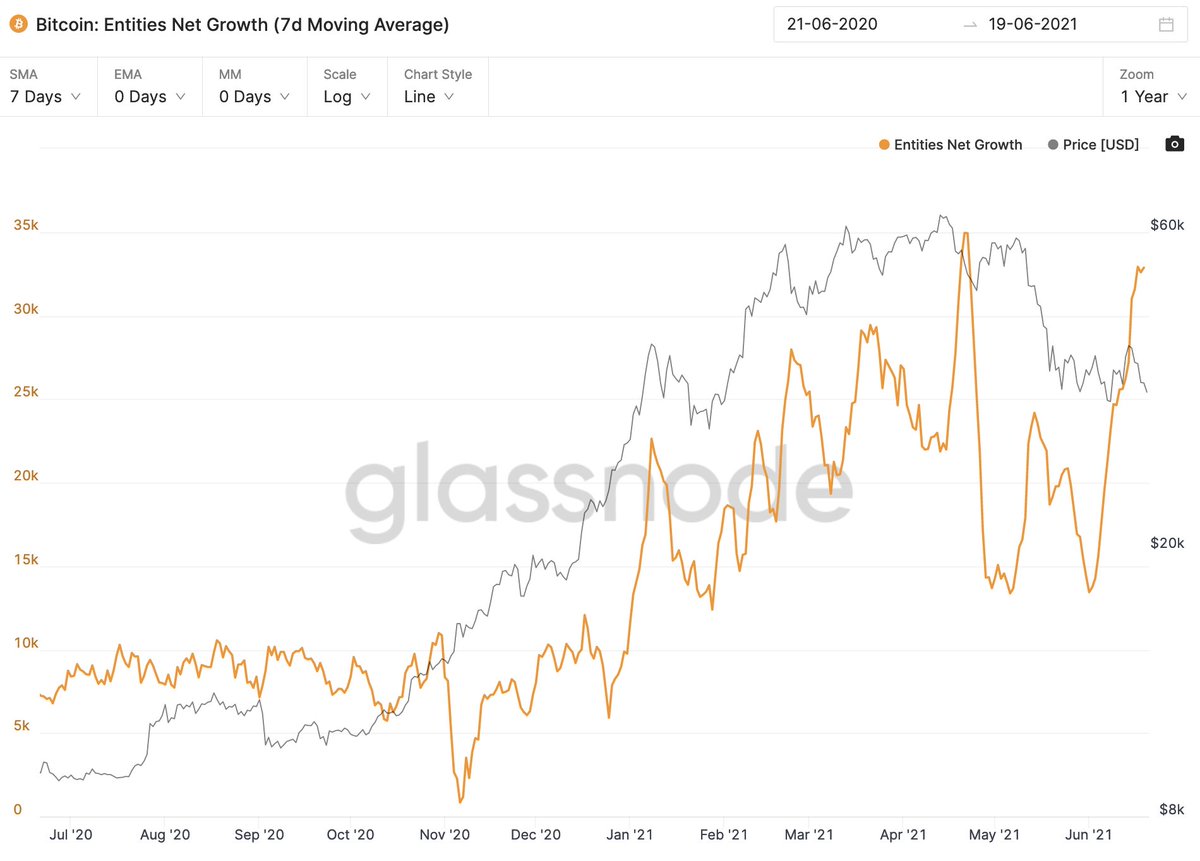
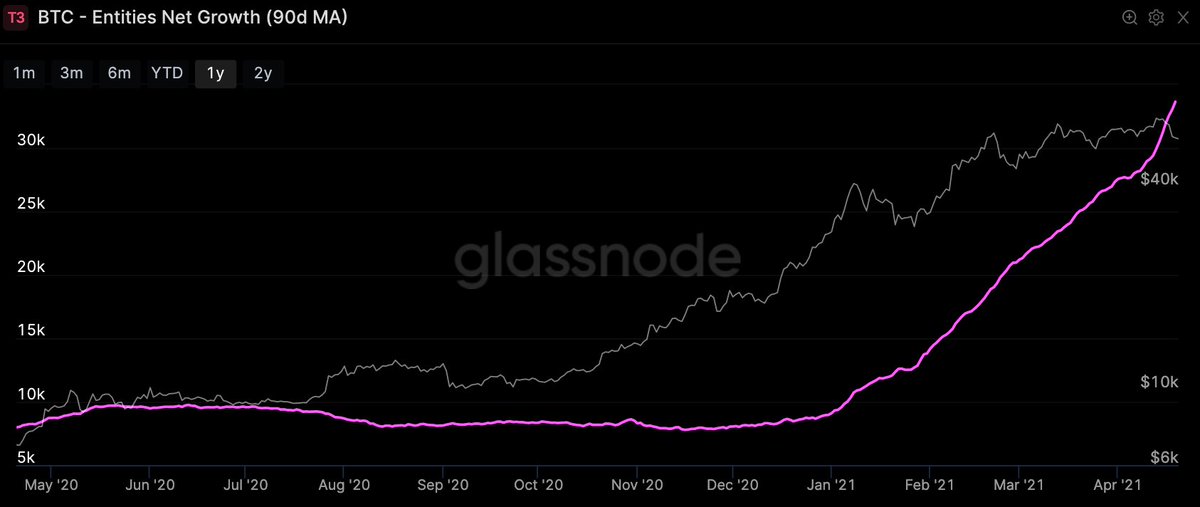
User growth as strong as ever on the network.
So yeah, it's definitely a bear market folks.
🙄←sarcasm
We should all panic sell because traders tell us there's two moving averages that just crossed and they carry the name "death" in it. Sounds so scary. 😱
This tweet was brought to you with the help of @glassnode on-chain data.
Cryptotwitter tells me this data is a hopium conspiracy; I can neither confirm or deny this fact, but please post me your bear porn.
• • •
Missing some Tweet in this thread? You can try to
force a refresh
#marketupdate, IMO from on-chain is sideways then bullish in maybe a week or so.
Some downside risk if stonks tank, a lot of rallying in the DXY (USD strength) which is typical of money moving to safety.
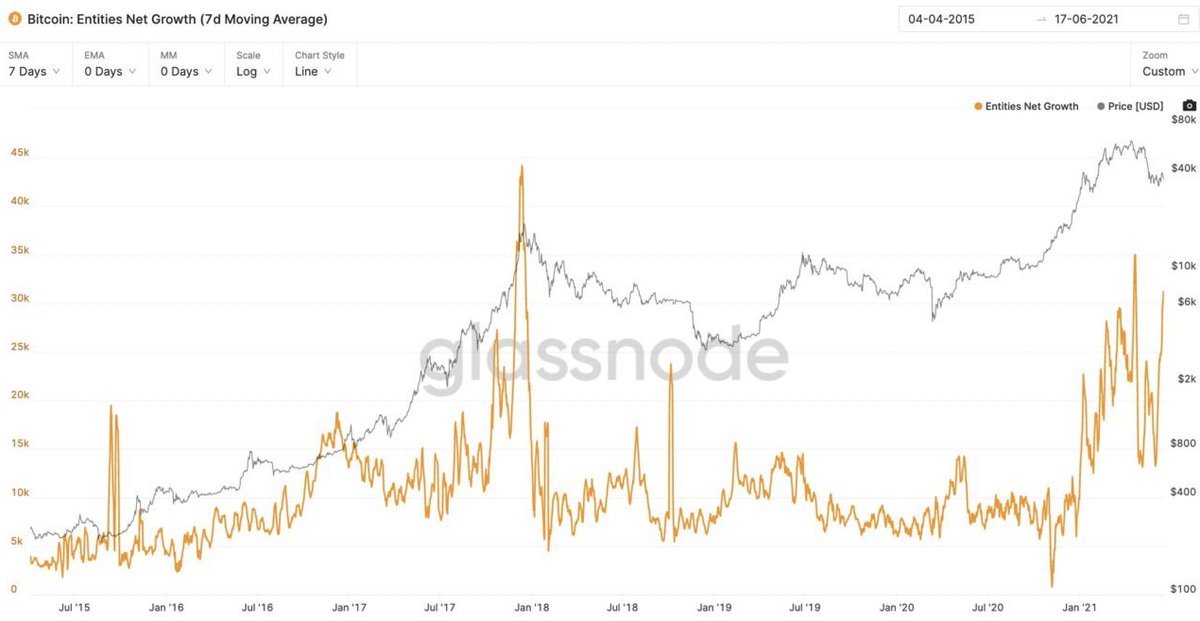
The first thing to look at is to answer "are we in a bear market". Welp, bear markets start when no new buyers enter to support price and that aint happening, we have healthy growth of new users joining the network.
Let this frame all other metrics.
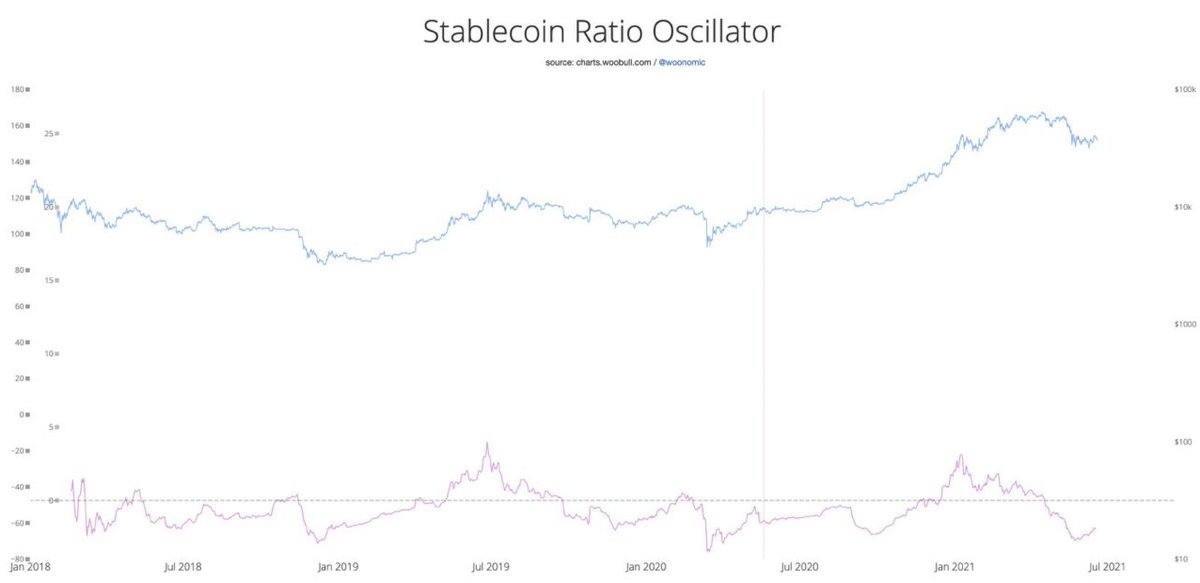
Of primary interest is capital rotation from stablecoins back into the crypto markets (I'll say that's mainly BTC since alt coins are reducing in dominance).
All of that dry powder sitting on the sidelines has started flowing back in.
Exchange dominance increased over time. This had the effect of making a proportion of the long term investor volume invisible to on-chain analysis, only happening inside exchanges.
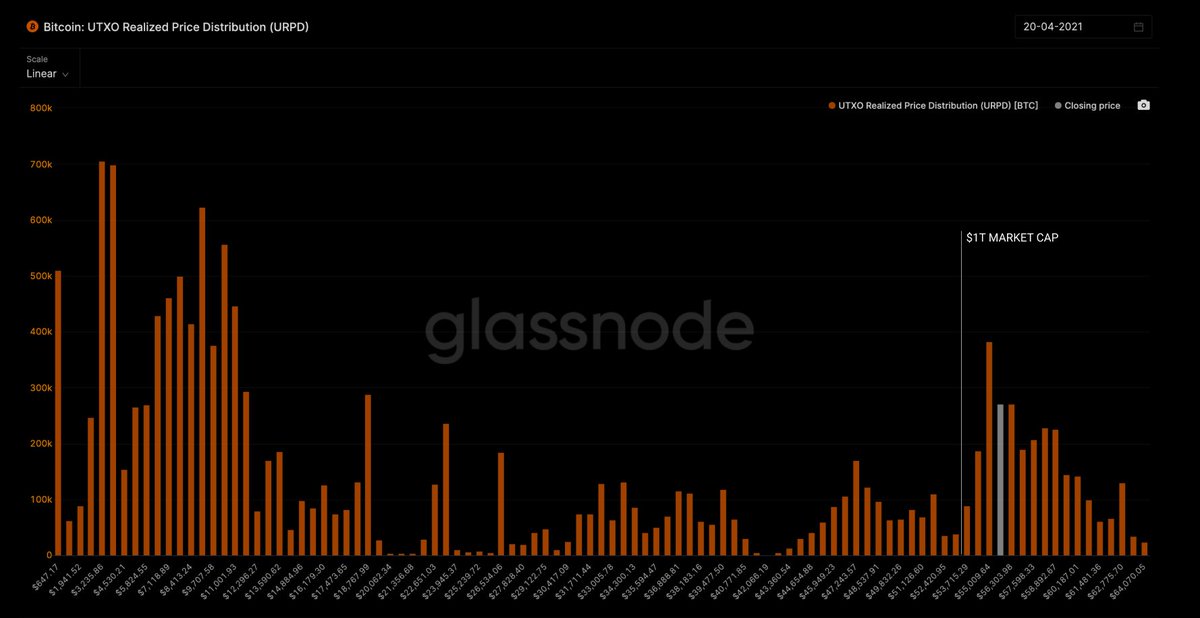
This revisit of lower price has created incredibly strong price validation for Bitcoin about $1T cap. 14% of the supply last moved above $1T cap.
This is a key line in the sand imprinted into BTC's price discovery, an area of immense support.
Anyone thinking we are going into a prolong price correction needs to know about the rate of new users coming into the network per day. We're in the middle of a bull market with a hockey stick of new adoption, especially in the last 2 weeks.
Coins continue to move to very strong holders (the Rick Astleys of this world). And moving at all-time-high rates.
Chinese miners went offline 3hrs into the difficulty adjustment.
The difficulty adjusts every 2 weeks to match the natural increase in hash rate from miners. This keeps block times to a steady 10 mins. If you're going to slow the network down, this is the best window to do so.
9.5hrs into the difficulty adjustment, 9000 BTC was deposited into Binance, this provided enough selling pressure to drop the Bitcoin price below $59k support, forcing the $4.9b of liquidations.
It's an interesting timing of events.
We have 11 more days before the next difficulty adjustment corrects for any loss in miner hash rate. Note the hash rate is already returning to the network.
This is an addendum to my price crash post mortem thread: