#COVID19 UPDATE THREAD – JULY 2
All graphics are 7-day averages. Raw reporting for each metric is in the tweet below.
(Data retrieved directly from state dashboards. Not every state updates its numbers daily.)
UNITED STATES
All graphics are 7-day averages. Raw reporting for each metric is in the tweet below.
(Data retrieved directly from state dashboards. Not every state updates its numbers daily.)
UNITED STATES

*Combined* Weekly raw metrics:
- Tests: 4,816,638 (+315,048)
- Cases: 93,543 (+16,138)
- Deaths: 1,770 (-396)
- Hospitalized: 14,327 (+471)
- ICU: 2,834 (+29)
(Tests/Cases/Deaths: +/- = chg from total last week)
(Hosp/ICU: +/- = total chg from last Friday)
- Tests: 4,816,638 (+315,048)
- Cases: 93,543 (+16,138)
- Deaths: 1,770 (-396)
- Hospitalized: 14,327 (+471)
- ICU: 2,834 (+29)
(Tests/Cases/Deaths: +/- = chg from total last week)
(Hosp/ICU: +/- = total chg from last Friday)
*Average* Daily raw metrics:
- Tests: 688,091 (+45,007)
- Cases: 13,363 (+2,305)
- Deaths: 253 (-57)
- Hospitalized: 14,327 (+67)
- ICU: 2,834 (+4)
(Tests/Cases/Deaths: +/- = change from daily avg last week)
(Hosp/ICU: +/- = daily avg chg from last Fri)
- Tests: 688,091 (+45,007)
- Cases: 13,363 (+2,305)
- Deaths: 253 (-57)
- Hospitalized: 14,327 (+67)
- ICU: 2,834 (+4)
(Tests/Cases/Deaths: +/- = change from daily avg last week)
(Hosp/ICU: +/- = daily avg chg from last Fri)
After ~4 months of gathering and posting state dashboard data, this will be our last day. I’ll still post regularly on Covid data and trends to keep the fancy talking heads honest and provide context to the numbers. But the dashboard-to-pastel graphic pipeline is off.
A big thank you to my team of dashboard wonks and data gatherers: @Travis__Terrell, @bowlernicole, @jacalnash, @corilisaa, @Nayps, @districtai, @eviltwingiraffe, @laurenmozz, and @annexietie.
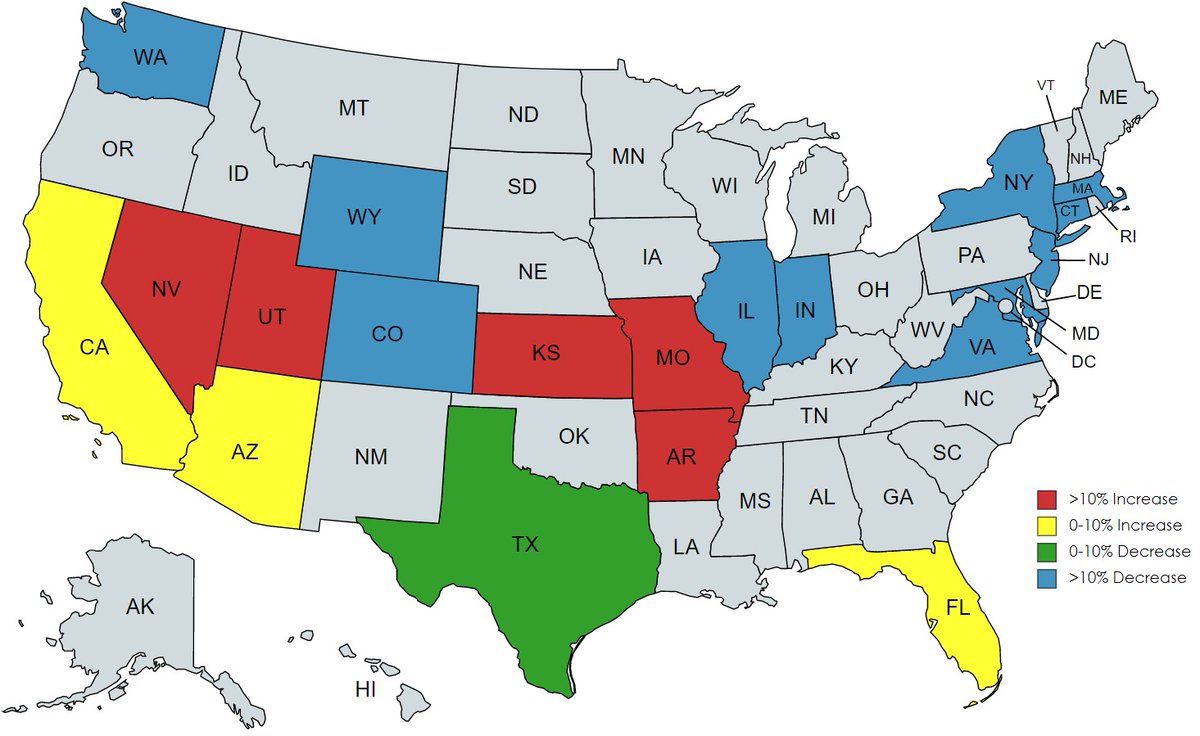
On to the data…I added “1 year ago” to the graphic in the top post (in red). It’ll give you a better idea about how the two summer increases compare as we enter the holiday weekend. Thankfully, I won’t have to deal with educating folks on the “graph o’ science” anymore.
It appears that Delta is now the dominant US strain. Yet we’re essentially wide open, travel is sneaking closer and closer to 2019 levels, and our metrics aren’t anywhere near last year—or even near this past April. That’s a good thing.
We do have some hot spots though. The following states have at least 20 more raw hospitalizations & >10% increase over last week: AL, AR, CA, IA, IN, MO, MS, NV, OK, UT.
4 weeks ago, there were *zero* states that met both those criteria.
4 weeks ago, there were *zero* states that met both those criteria.
What’s this mean? Well, it means that it might’ve been worth listening to the half-dozen or so Twitter folks who called a (mostly) southern summer stimulus. We’re watching a battle between Delta + Summer vs. Vaccines + Prior Infection. And the latter are holding their own so far.
It’s hard to remember (because humans have the attention span of a ferret), but we were at 5x our current cases and 3x our current hospitalizations—in mid-to-late April. Of this year! As we hit lower baselines before each rise, higher % increases are still lower absolute numbers.
For example: we’re up more than 20% from our pandemic lows in 7-day-averaged cases (just 2 weeks ago). But we’re lower than every single day in the pandemic prior to June—by 30%. And though I expect rises for another ~3 weeks or so, Covid's fuel keeps running low nationally.
So, while our team won’t be putting out the data organically anymore, I’ll certainly be following and commenting on it. Thank to all of you for joining me in the data goo though—many of you for more than a year now. Maybe I’ll finally collect on some of those offered beers…
It’d be rude not to post the regionals on the last day, right? I’ll get them out shortly.
In the meantime, I present “Tank Dog”:
In the meantime, I present “Tank Dog”:
TEXAS

CALIFORNIA

FLORIDA
*Didn't report hospitalizations for a couple weeks, so I used the very first day with 7 days to average for the hospitalization number (7/16).
*Didn't report hospitalizations for a couple weeks, so I used the very first day with 7 days to average for the hospitalization number (7/16).

SOUTHEAST
(AL, AR, GA, KY, LA, MS, NC, SC, TN)
(AL, AR, GA, KY, LA, MS, NC, SC, TN)

SOUTHWEST
(AZ, NM, NV, OK, UT)
(AZ, NM, NV, OK, UT)

PACIFIC NORTHWEST/ROCKIES
(CO, ID, MT, OR, WA, WY)
(CO, ID, MT, OR, WA, WY)

GREAT PLAINS
(IA, KS, MN, MO, ND, NE, SD)
(IA, KS, MN, MO, ND, NE, SD)

GREAT LAKES
(IL, IN, MI, OH, WI)
(IL, IN, MI, OH, WI)

MID-ATLANTIC
(DC, DE, MD, PA, VA, WV)
(DC, DE, MD, PA, VA, WV)

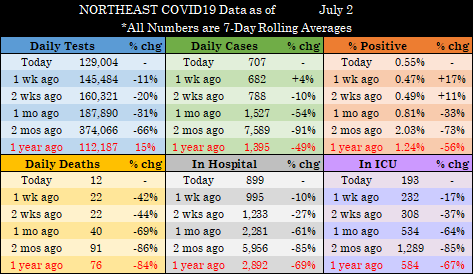
NORTHEAST
(CT, MA, ME, NH, NJ, NY, RI, VT)
(CT, MA, ME, NH, NJ, NY, RI, VT)
Wow, we've come a long way...
https://twitter.com/TheLawyerCraig/status/1261748895765483525?s=20
• • •
Missing some Tweet in this thread? You can try to
force a refresh