I wanted to take a look at the trend in hospitalization census in states that are now predominantly #DeltaVariant according to the graphic below (including FL & IL, which are close). I'll do some comparisons to Alpha back in April as well.

🧵Thread🧵
First, here is a map of the 2-week change in 7-day-average hospitalization census for each of the states above (according to state dashboards as of yesterday's data, compared to the average on Friday 2 weeks prior):
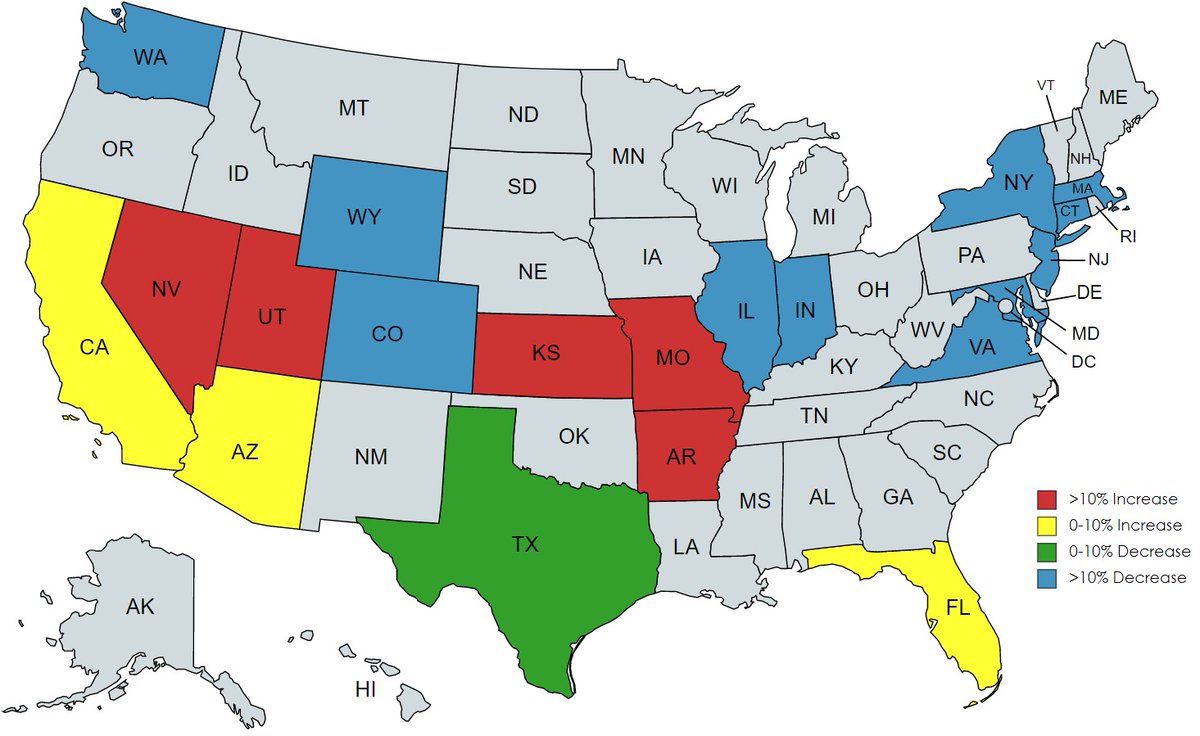
At a glance, low vax states tend to be doing the worst, which makes intuitive sense (though we're discounting prior infection by looking only at vax status, of course). But there are outliers. For example, why should IN be on a better trajectory than CA?
And why aren't low-vax counties in NY (for example) doing worse than high-vax counties in CA? Delta's likely predominant in both.

For example, 0 of the 29 NY counties that are *below 50%* fully vaxxed show a 2-week rise in average hospitalization census. None. But in CA...
8 out of the 15 CA counties that are *above 50%* vaxxed show a 2-week increase in the average hospitalization census. That strikes me as odd if the equation is simply Delta + Low Vax = Trouble. Clearly other factors are at play.

(County data from @nytimes as of today)
Population density? Certainly makes some sense. But of course, the spread of Delta in the mid-South, lower heartland, and West is moving through lower-density population areas without much issue right now.
I still can't help but feel the southern latitude is at least a material factor. And one primary reason that makes some sense is when you look at the map of hospitalization change in mid-April when the #AlphaVariant became dominant. Let's take a look:
Vaccination percentages were lower across-the-board in April, of course, but the states doing the best and worse in terms of vaccination percentages pretty much map onto the states doing the best and worst right now.
Why was the eastern seaboard and Midwest essentially the mirror image of right now (NY excepted), despite generally being among the most vaxxed? Those states in green were all among the bottom half of vaccination percentage. How'd they avoid getting smacked with Alpha (a la MI)?
I don't have all the answers, but I sure hope that smart folks are looking for them. Imagine if pandemic response in 20 years could be on a micro-regional basis based on predicted spread in case we need to preemptively coordinate for care in certain locales.
I just don't want the upshot of the last 18 months to be: distancing, masking, and vaccination are the sole drivers of Covid and nothing else is worth the time or effort.

• • •

Missing some Tweet in this thread? You can try to force a refresh
 

Keep Current with Craig

Craig Profile picture

Stay in touch and get notified when new unrolls are available from this author!

Read all threads

This Thread may be Removed Anytime!

PDF

Twitter may remove this content at anytime! Save it as PDF for later use!

Try unrolling a thread yourself!

how to unroll video
  1. Follow @ThreadReaderApp to mention us!

  2. From a Twitter thread mention us with a keyword "unroll"
@threadreaderapp unroll

Practice here first or read more on our help page!

More from @TheLawyerCraig

3 Jul
#COVID19 UPDATE THREAD – JULY 2

All graphics are 7-day averages. Raw reporting for each metric is in the tweet below.

(Data retrieved directly from state dashboards. Not every state updates its numbers daily.)

UNITED STATES
*Combined* Weekly raw metrics:

- Tests: 4,816,638 (+315,048)

- Cases: 93,543 (+16,138)

- Deaths: 1,770 (-396)

- Hospitalized: 14,327 (+471)

- ICU: 2,834 (+29)

(Tests/Cases/Deaths: +/- = chg from total last week)
(Hosp/ICU: +/- = total chg from last Friday)
*Average* Daily raw metrics:

- Tests: 688,091 (+45,007)

- Cases: 13,363 (+2,305)

- Deaths: 253 (-57)

- Hospitalized: 14,327 (+67)

- ICU: 2,834 (+4)

(Tests/Cases/Deaths: +/- = change from daily avg last week)
(Hosp/ICU: +/- = daily avg chg from last Fri)
Read 24 tweets
1 Jul
#COVID19 UPDATE THREAD *SUN BELT* – JULY 1

All graphics are 7-day averages.

(Data retrieved directly from state dashboards. Not every state updates its numbers daily.)

SUN BELT
(AL, AR, AZ, CA, GA, LA, MS, NM, NV, SC, TN, TX) Image
Today’s Sun Belt raw reported metrics:

- Tests: 202,436 (-19,171)

- Cases: 6,956 (+1,917)

- Deaths: 141 (-32)

- Hospitalized: 5,934 (-49)

- ICU: 1,303 (-29)

(Tests/Cases/Deaths: +/- = chg from raw count same day last week)
(Hosp/ICU: +/- = chg from yesterday’s census)
Last Sun Belt-only update this week. Tomorrow we’ll have the US numbers and standard regions. Hospitalizations and ICUs down from yesterday, and deaths down from last week. Cases are up, though CA is still reporting backlogged cases this entire week (& is ~40% of the increase).
Read 6 tweets
14 Jun
This is untrue in several respects, and this is getting awfully frustrating. I'll touch on a few of them...
First, we're not "2 weeks past the Memorial holiday weekend data issues." Memorial Day deflates reported cases & deaths for *days after* Memorial Day. The Tuesday is extremely deflated, and usually it takes days to return to normal pipeline reporting. This time was no different.
Also, what do you think happens to the 7-day average when metrics are deflated into the middle or late portion of the holiday week? It captures that deflation and carries it further, of course. So the 7-day average is artificially low typically through the *following* ~Wed.
Read 14 tweets
13 Jun
Got a bit curious about the US v. UK as it relates to the #DeltaVariant. Some good news on that front for the US: at least in the early stages, the US rate of increase is nowhere near the UK.

🧵thread🧵
First: I used covariants.org/per-country, which shows percentage of sequenced variants based on 2-week blocks. One potential point of confusion to note when you use the site: the dates along the x-axis indicate the *start* of the 2-week period.
Here are the percentages of sequences that made up the #DeltaVariant in the UK (by 2-week period):

3/22-4/04: 0.09%
4/05-4/18: 1.45%
4/19-5/02: 8.92%
5/03-5/16: 33.17%
5/17-5/30: 72.58%
Read 15 tweets
12 Jun
Arizona was the first state to show sharp rises during the 2020 summer wave. In fact, we already saw movement by this time last year. So here's a thread comparing AZ's 2020 and 2021 trends. I looked at the 2021 7DA ending 6/11 v. 5/21 and 2020 7DA ending 6/12 v. 5/22.

🧵thread🧵
First, I used a 3-week comparison to place 2020 and 2021 on as even a footing as possible. Memorial Day 2020 was 5/25, so using 1 or 2 weeks would have placed Memorial Day in either 2021's or 2020's comparisons. Not good. Also, all % changes are weekly, not for the 3-week period.
2020

(5/22 ➡️ 6/12; metrics are 7-day avgs)

Cases: 348 ➡️ 1,227 (+84.0% weekly)
Tests: 8,121 ➡️ 12,092 (+16.3%)
% Pos: 4.29% ➡️ 10.14% (+45.5%)
Hosp: 802 ➡️ 1,277 (+19.7%)
ICU: 319 ➡️ 412 (+9.6%)
Deaths: 17.7 ➡️ 18.9 (+2.2%)

Significant 2020 increases (except lagging deaths).
Read 13 tweets
12 Jun
#COVID19 UPDATE THREAD – JUNE 11

All graphics are 7-day averages. Today’s raw reporting for each metric is in the tweet below.

(Data retrieved directly from state dashboards. Not every state updates its numbers daily.)

UNITED STATES Image
Today’s raw reported metrics:

- Tests: 874,909 (-251,449)

- Cases: 14,354 (-5,462)

- Deaths: 481 (-111)

- Hospitalized: 16,577 (-424)

- ICU: 3,501 (-103)

(Tests/Cases/Deaths: +/- = change from raw count same day last week)
(Hosp/ICU: +/- = chg from yesterday’s census)
Really a solid Friday to end the week. First week ever with no days above 500 raw reported deaths. First week ever with no days above 15k raw reported cases. Large case drop from last Friday. And new pandemic low—again—for positive testing percentage.
Read 6 tweets

Did Thread Reader help you today?

Support us! We are indie developers!


This site is made by just two indie developers on a laptop doing marketing, support and development! Read more about the story.

Become a Premium Member ($3/month or $30/year) and get exclusive features!

Become Premium

Too expensive? Make a small donation by buying us coffee ($5) or help with server cost ($10)

Donate via Paypal Become our Patreon

Thank you for your support!

Follow Us on Twitter!

:(