#NJ #COVID19 Hospital Admission data, updated today through late last week. This will be stratified by age. Note that all these graphs will be 7 day sums. Divide by 7 to get the daily average admissions.

First, the total

Averaging about 24 confirmed hospitalizations per day

/1
First, pediatric and 18-19 yr olds. There hasnt been an 18-19 yr old admitted with confirmed covid in quote some time, and none through our entire fall wave, yet we are mandating vaccines for college kids. Insane.

/2
Second, 20-29 yr olds. Hasnt been a 20-29 yr old admitted with confirmed covid in almost a month. Again, college kids getting mandated to take a vaccine. Insane.

/3
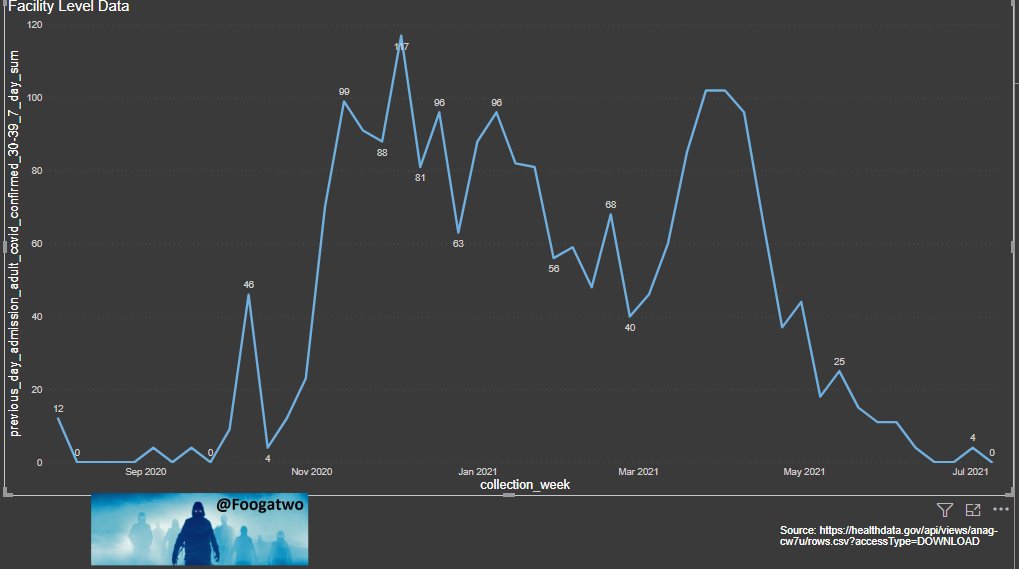
Third, 30-39 yr olds. None in the last week, a handful the weeks before. How many of these are admitted for pregnancy or some other reason and pop positive on a PCR?

/4
Fourth, 40-49 yr olds. None in the last week, and like 30-39, a handful in the previous weeks. How many of these are admitted for some other emergency procedure and pop positive on a PCR?

/5
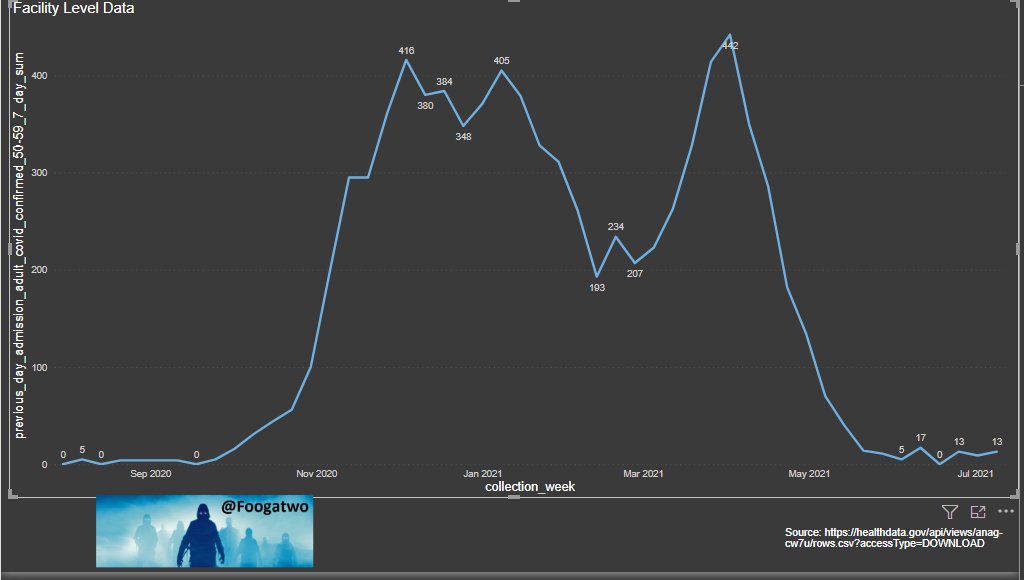
Fifth age group, the 50-59 yr olds. For whatever reason, this is the age group currently most impacted now. Wish we ever got a breakout of in the hospital FOR covid vs WITH covid. But we'll likely never know.

/6
Sixth Age group, 60-69 yr olds. This is where deaths due to hospitalization risk begins to ramp up. Admissions? Only a handful per week. Total immunity impacts? Seasonality? Either way, this is no different versus late last summer when there was no vaccines.

/7
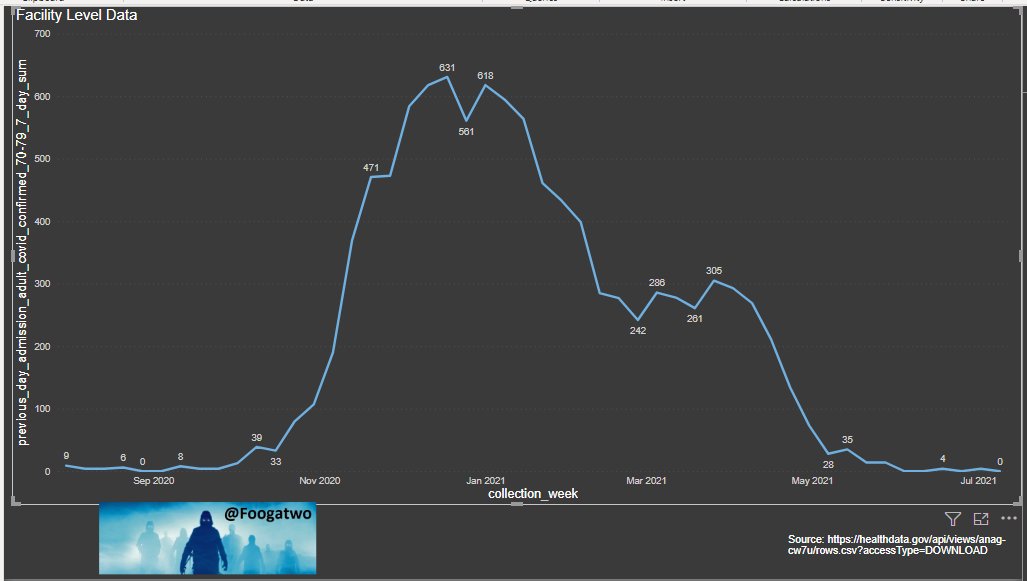
Seventh Age group, 70-79 yr olds. Higher risk of death due to hospitalization. No admissions in the last week and only a handful in the last month. Sensing a pattern here?

/8
Finally, the 80+ age group. Highest risk of death due to hospitalization. The admissions? Near zero for the last month. Similarly to last summer with no vaccine.

/9
So how could there be so few admissions per week, but our hospitalization census is still elevated and hovering around 300-330?

Several obvious reasons:
a) Counting too many PUIs as covid but arent TP (Inflating CLI)
b) Too many WITH vs. FOR, skewing the numbers
c) Bad data

/10
As mentioned before, theres a huge disconnect. Is Remdesevir driving hospital stays well beyond how long they should be in there?

Are hospitals gaming the system for more $$$?

Remains to be seen, but one thing is for sure. The data isnt adding up.

/end

• • •

Missing some Tweet in this thread? You can try to force a refresh
 

Keep Current with Woke Zombie 😊

Woke Zombie 😊 Profile picture

Stay in touch and get notified when new unrolls are available from this author!

Read all threads

This Thread may be Removed Anytime!

PDF

Twitter may remove this content at anytime! Save it as PDF for later use!

Try unrolling a thread yourself!

how to unroll video
  1. Follow @ThreadReaderApp to mention us!

  2. From a Twitter thread mention us with a keyword "unroll"
@threadreaderapp unroll

Practice here first or read more on our help page!

More from @AWokeZombie

19 Jul
#NJ #COVID19

Took me awhile to get the data together for this. So here it goes.

If you didnt realize it when you saw these bullshit numbers. They are all a guise to push vaccines. Thats it.

I'll try to walk through this in as few tweets as possible.

/1
First up, nowhere does it make any sense to push population level numbers. Reporting these as 'effective' is just a disgusting mis-appropriation of the math. Today, 324 people tested positive. That means 8,999,676 didnt, or 99.9964%. Idiotic to present it that way? Of course.

/2
Yet, somehow the Gov and his DOH thinks it ok to just pull that out of their ass and claim it means that the vaccine is 99.99999999% effective. Here's the truth. its not.

What they failed to realize is they gave us some important data today that made this easy to fact check

/3
Read 16 tweets
1 Jul
#NJ #COVID19 Screaming into the void. 1 region (SW) goes from green to yellow. At record low cases, record low hospitalizations. I can't stress how bogus this truly is. You're being warned, if this isnt fixed or brought to the surface by the media, it will screw us in the fall
/1
Case rate metrics have been set by an organization who's mission is a #ZeroCovid outcome. Not the CDC, not the State DOH, but CovidactNow. Why? With false positives and these testing levels, cases below 1/100k are NOT possible.

/2
Percent Positivity is NOT de-duplicated, so every double test positive gets counted. This overinflates true % positivity. Never been questioned, never been explained.

/3
Read 8 tweets
25 Jun
#US #COVID19 Natural Immunity > Vaccine Immunity
🧵

This is the SIREN study in the UK. Of 32k healthcare workers, 10k were covid positive during the pandemic, defined as either PCR + or having AB. Of those 10k only 241 during the entire pandemic have been reinfected.

/1
Key note here:

As Delta has increased from 0 to 90% of all cases, reinfections remain flatlined.

Since Delta has gone from 0 to 90% of all cases, refinection rates are hovering at 0.2 reinfections per 1000 cases.

/2
Meanwhile, since the start of Delta in February, 4,087 of the 60,624 infections have been complete breakthrough infections, meaning > 14 days after the second dose.

This equates to a rate of 67.4 breakthrough infections per 100k

/3
Read 7 tweets
4 Jun
#US #COVID19 Talking points issued. 12-15 Vaccination demand is waning, CNN/MSNBC/White House and all the muppets will be screaming from now through Sunday at how kids are being hospitalized. Push back on the non-sense, because its just not true!

Talking Point #1: Hospitalizations as a percent are up!
Debunking: They are up as a % because all other ages are way down, but they child hospitalizations are still DOWN
Talking Point #2: These kids are in the hospital for covid!
Debunking: No, many of them (CA study found up to 40%) are in the hospital for something else and just happened to test positive.
Read 7 tweets
5 May
#NJ #COVID19 Case update for 5/5. Mass Deletions continuing. Groundhog day. Growing increasingly frustrated with inability of *ANYONE* to press this issue.
Where's the media?
Where's the legislature?
Where's the Concern/Outrage?

Another 895 deletions. *13,092* in 10 days.
They are rewriting the epi curve. They are giving the public no transparency. Where the hell are the people running against Murphy? Look at what rewriting it has done to the curves. The winter wave is soon going to be similar than the Spring bump, with no explanation.
They are out of cases to harvest. The cumulative delta is negative.

Cases are close to the 1500 range, but we keep reporting under 100. This is going to crush Rt when it ends.

Reported: 1309 (??)
Adds: 1784 (!!) Love the 62 dumped on March 13th.
Deletions: 895 (!!)
Net: 889
Read 4 tweets
26 Apr
#NJ #COVID19 Case update for 4/26, and its a doozy.

For those who don't know, at today's press conference, the state nonchalantly deleted 10,440 cases. Of course, everyone in the press in the room ignored it, and Lifshitz essentially read out a statement on what happened.

🧵
The state claims that deletions of duplicates were a manual process and they just, for the first time, automated the process. This automation picked up 10,440 cases that required deletion that the @NJDeptofHealth missed for months. I dispute that claim, and here is why:

/2
First, the case update for today:

Reported: 1247
Additions: 1069
Deletions: 10,265
Net: -9,196
DoD Change: -9,195

778 of the cases are from IO in the last 7 days. The other 291 are from older dates.

/3
Read 9 tweets

Did Thread Reader help you today?

Support us! We are indie developers!


This site is made by just two indie developers on a laptop doing marketing, support and development! Read more about the story.

Become a Premium Member ($3/month or $30/year) and get exclusive features!

Become Premium

Too expensive? Make a small donation by buying us coffee ($5) or help with server cost ($10)

Donate via Paypal Become our Patreon

Thank you for your support!

Follow Us on Twitter!

:(