I’ve updated my #Missouri #COVID19 website for Tuesday, 7/20 - slu-opengis.github.io/covid_daily_vi…. A few highlights are below 👇.
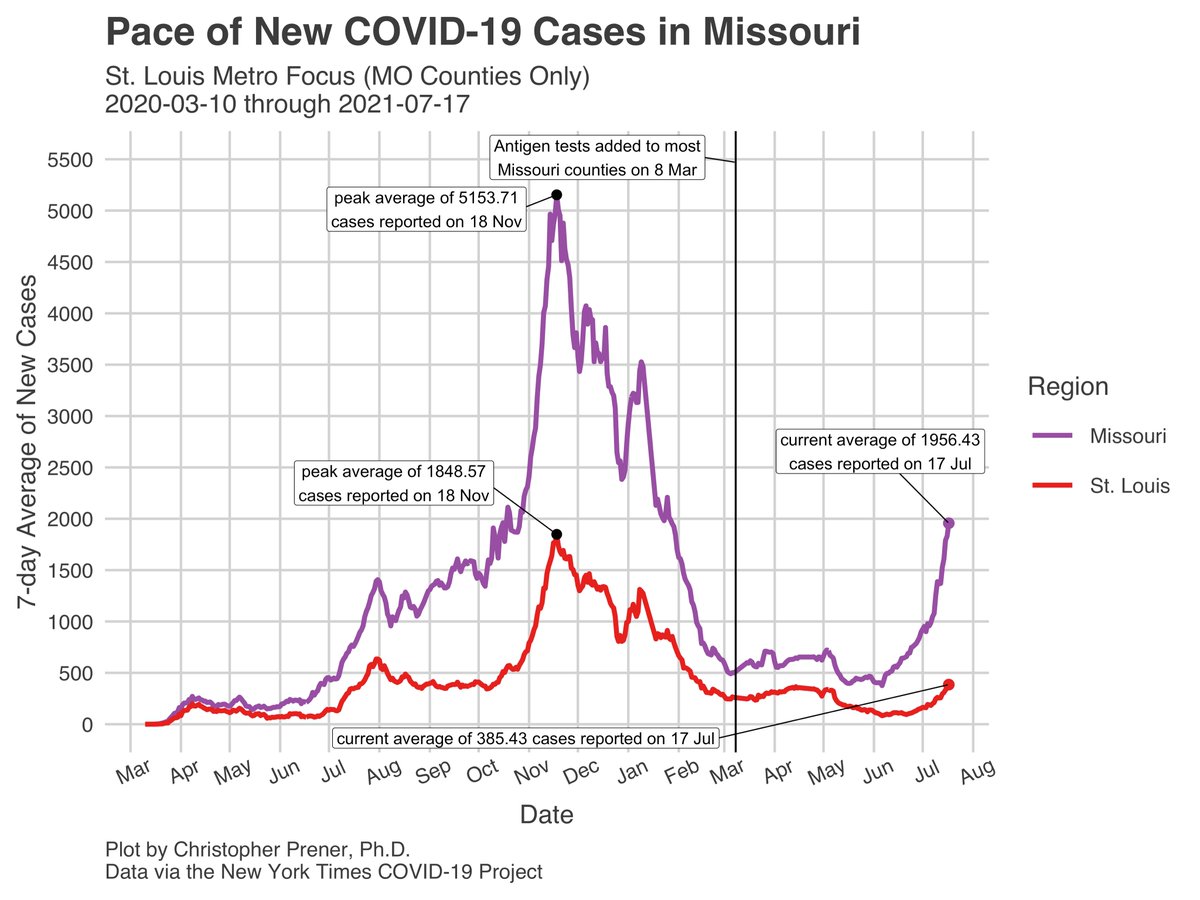
We’ve now plowed past 2,000 new cases per day on average in the last week, a place we were last at this past winter. 68% of new cases are outstate. 1/19
We’ve now plowed past 2,000 new cases per day on average in the last week, a place we were last at this past winter. 68% of new cases are outstate. 1/19


Recall that comparisons across time are hard because of various testing shifts. What is striking, though, is we have achieved significant transmission without either of our two largest cities being major contributors. This has been a rural and smaller metro outbreak so far. 2/19

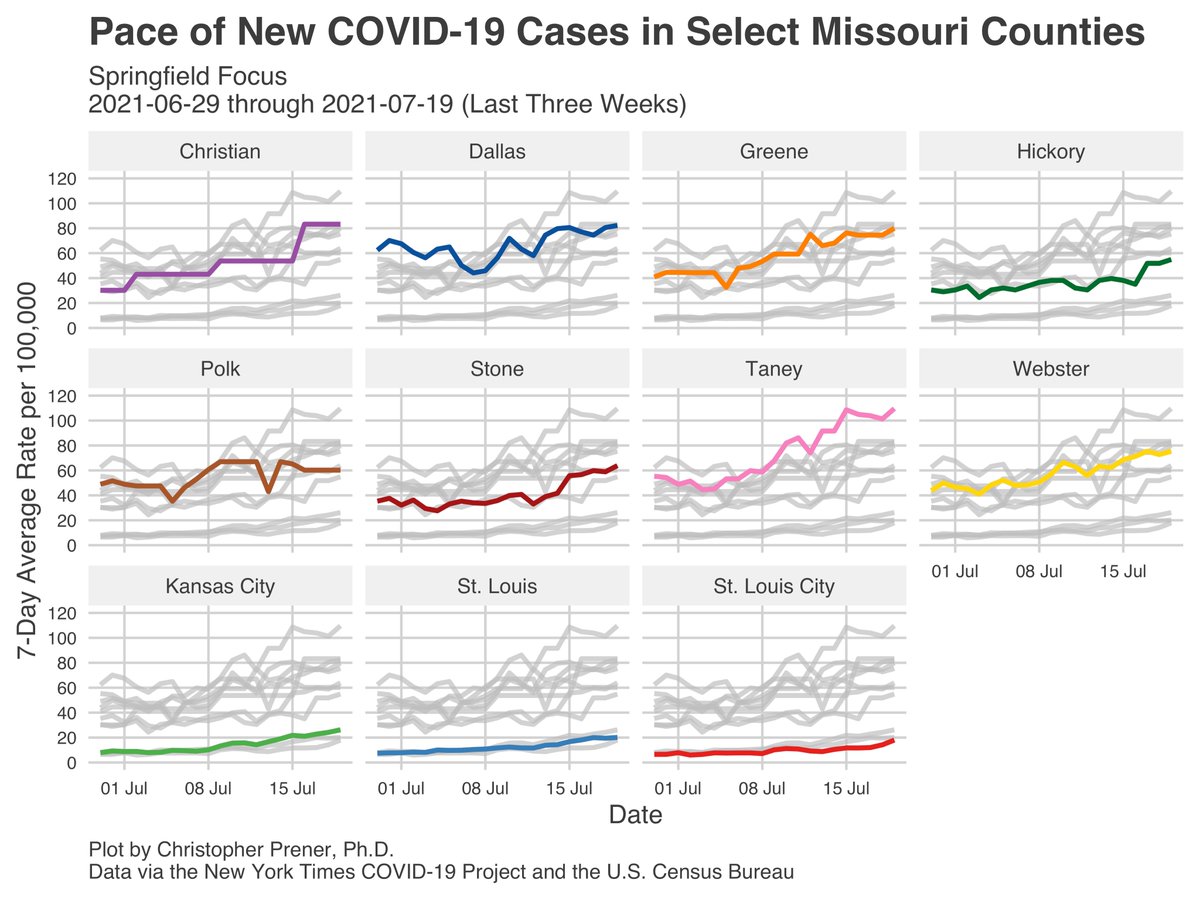
Rates around both Joplin and Springfield continue to hold at very high rates, with some counties (especially around Springfield) showing small upticks yesterday. There are also at least three counties around Springfield at all-time highs (with caveats again about comparisons). 3/


In the Ozarks to the east, the same trend is holding in rural counties that sit between I-44 and the Arkansas border as well as further north, around Lake of the Ozarks. 4/19


In Mid-MO, and adjacent counties to the west (between Columbia and #KCMO), we are seeing the same pattern - steep increases last week have given way to little changes over the past few days. 5/19


Together, these counties make up a large, four-state cluster of very high rates of new cases that continues to be unlike any other geographic concentration of COVID in the United States. This map from the NYTimes tells the tale 👇 6/19 nytimes.com/interactive/20…
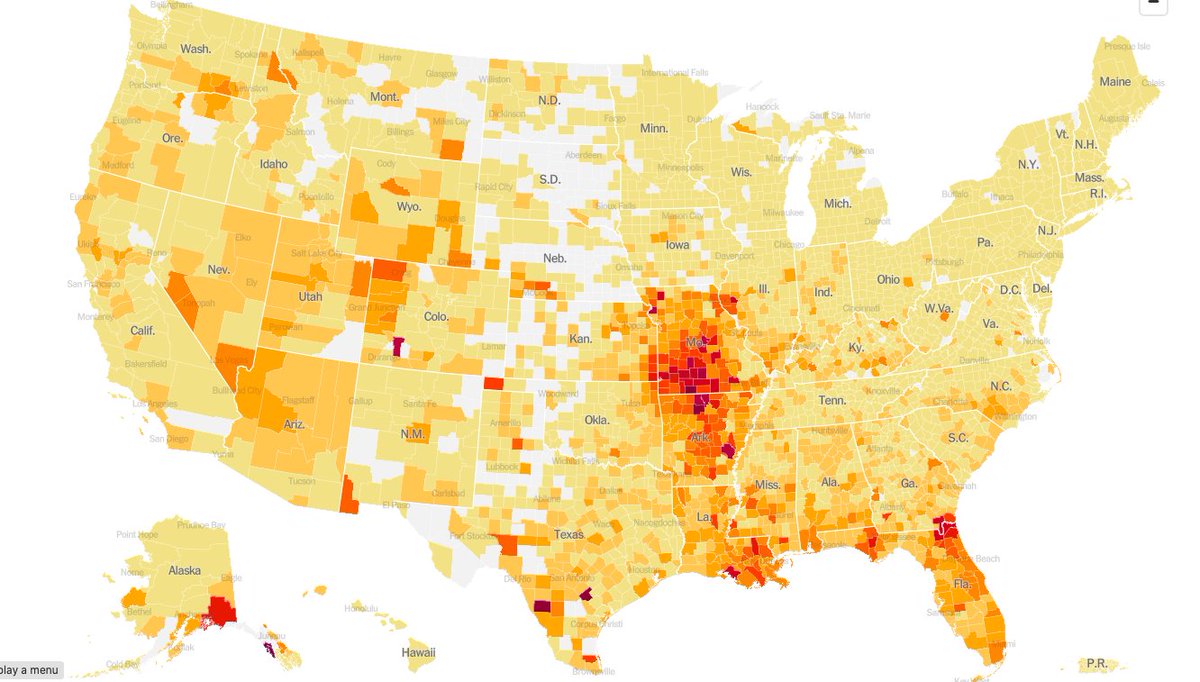
Missouri and Arkansas remain the two states with the highest rates of new cases nationally, and 8 of the 10 highest rate counties in the US (with populations over 10k) are in MO or AR. 7 of those 8 counties are in this “Ozark cluster.” 7/19

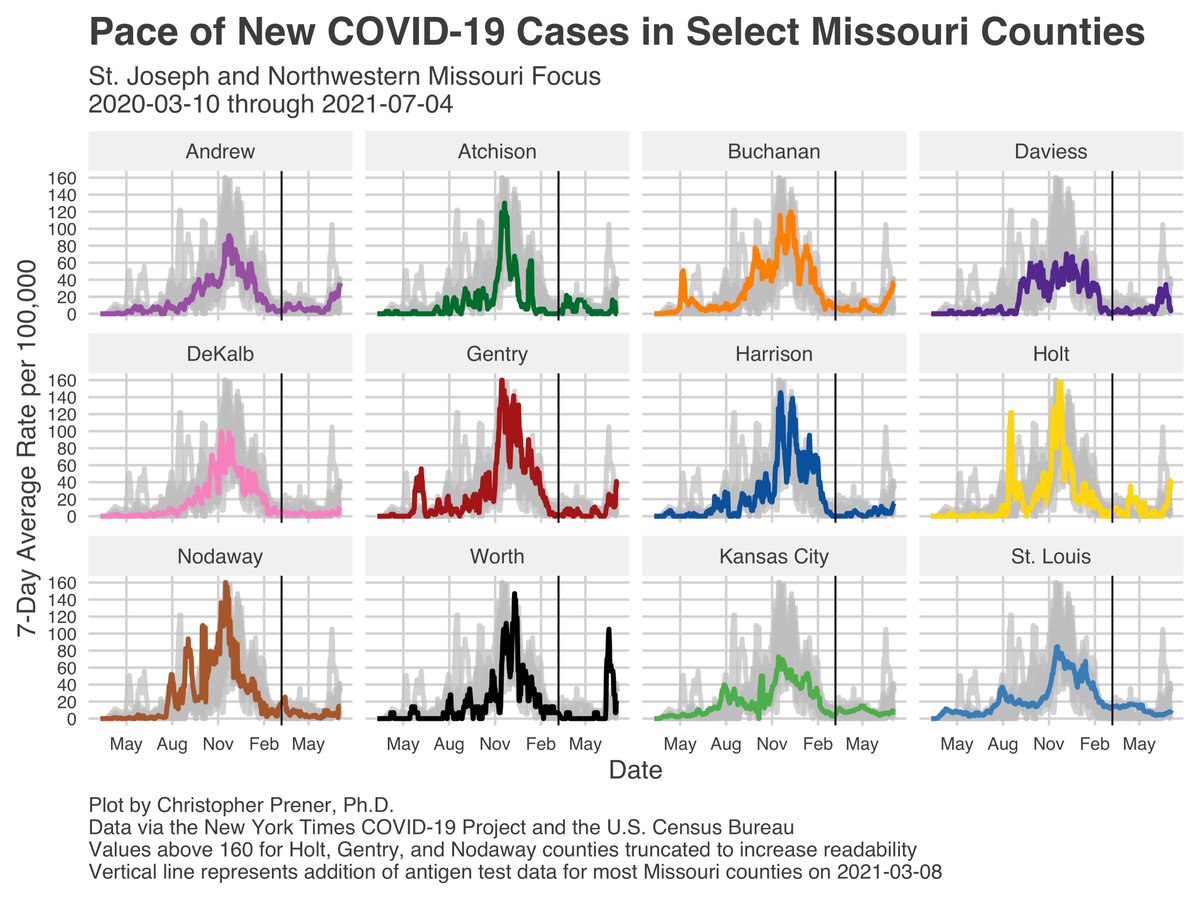
We’re also seeing an upswing in new cases around St. Joseph, MO. In addition to Andrew, Buchanan, and Gentry counties, this now includes Nodaway County (which had, until now, avoided the resurgence in new cases other Northern MO counties have seen). 8/19


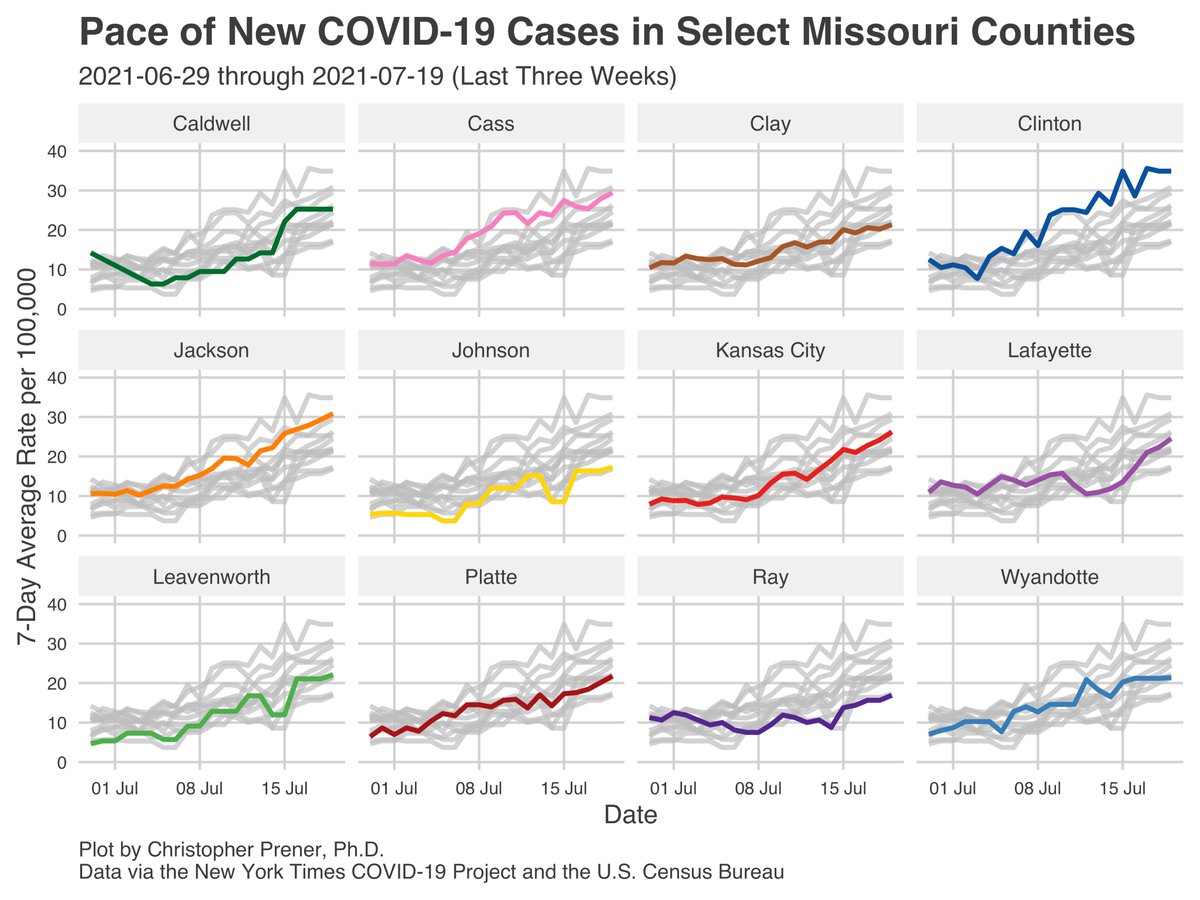
All of this is driving metro rates in SW MO, Mid-MO, and NW MO that are showing steep upswings. Jefferson City continues to stand out for just how quickly things escalated with new cases. 9/19

I noted last night that hospitalizations in this same group of metros are also rising significantly as well. In SW MO, those hospitalization rates are comparable to what we saw during the fall/winter surge. 10/19

In terms of new cases, both #KCMO and #StLouis look rather similar right now, with rates just a bit lower generally in STL, but both metros seeing steady increases to their 7-day averages. 11/19


Here in #StLouis, hospitalizations have continued to increase. The 7-day averages we are seeing now are comparable to where we last were in February, but are showing little sign of slowing down. We’ve seen in-patient numbers more than double in the last month. 12/19


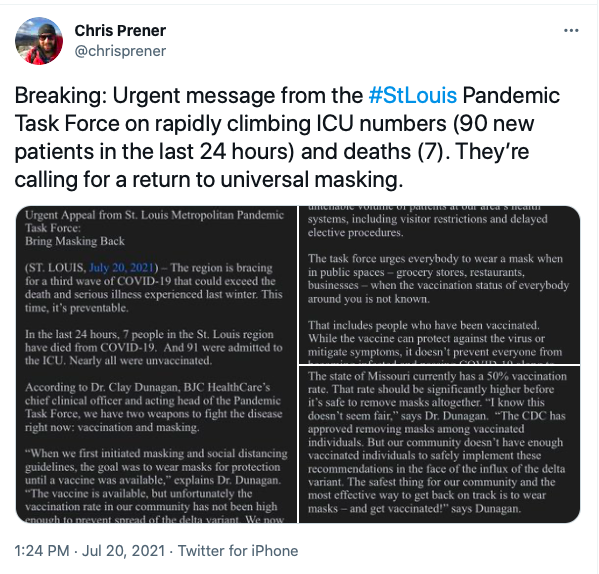
This is concerning enough that the Pandemic Task Force put out a warning today, urging folks in #StLouis to return to universal masking. Click through 👇 to read the full text of their statement. 13/19
https://twitter.com/chrisprener/status/1417538455383511044?s=20
Quite simply, the horse is out the barn door. I do not believe we have enough time in the STL and KC areas for vaccination encouragement to yield the rates we need to avoid significant spikes in new cases. In that context, we need additional measures. 14/19
The Task Force said that vaccines and masking are our two tools, but I disagree. There are other things we can do to buy our hospitals time, prevent overcrowding, and give people time to get vaccinated 👇. We need every tool in our toolbox right now. 15/19
https://twitter.com/chrisprener/status/1417537261093150725?s=20
Keep in mind this is happening in the context of significant racial disparities. Black and Latino individuals have borne a significant burden of illness. African Americans have borne a huge burden of death. We need to be doing everything we can to communicate… 16/19

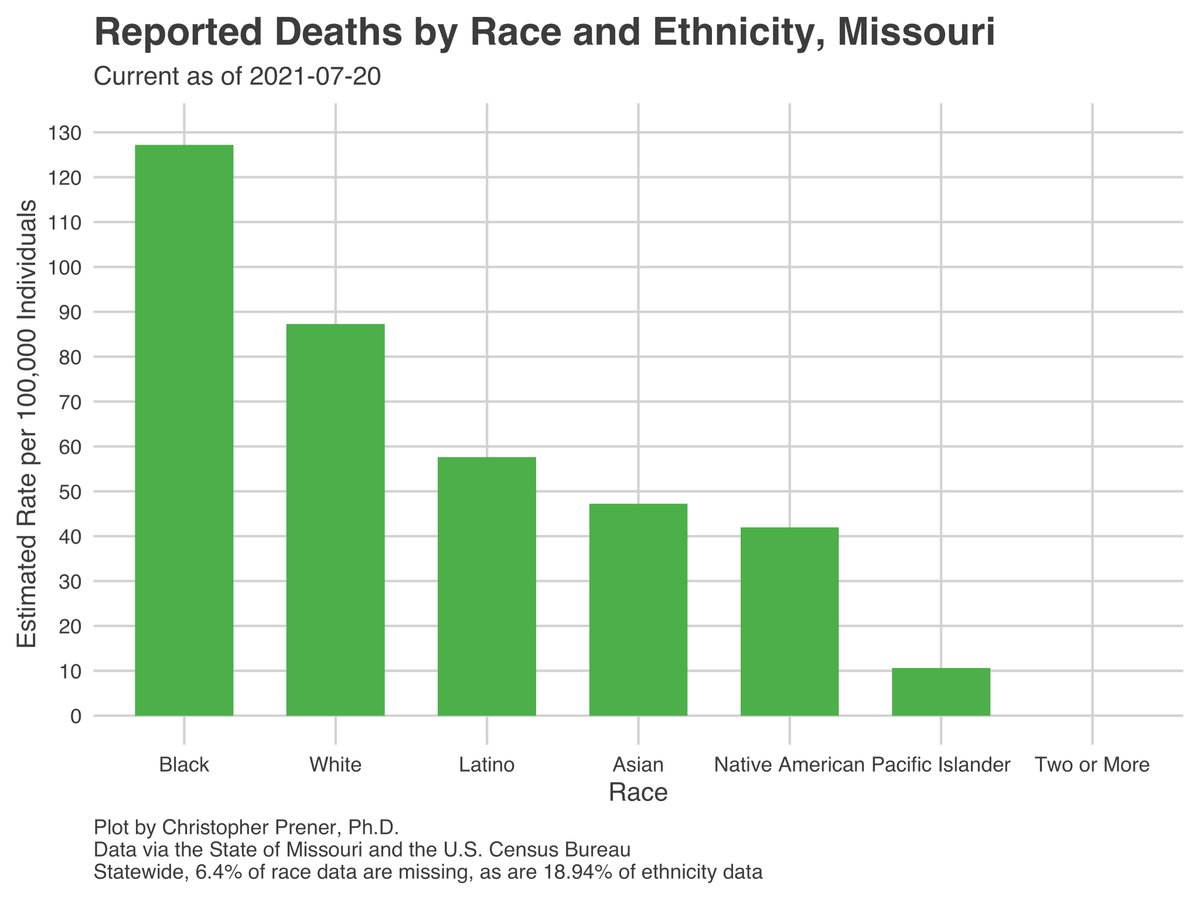


… the importance of vaccinations but we also need to do what we can to keep these disparities from getting worse. Rates at the ZIP code level are higher in North City and North County than they are elsewhere in the City and County. We must act decisively. 17/19

My standard caveats about uncertainty - infections (1) are historical data that reflect infections 2-3 weeks ago, (2) are biased by testing patterns, (3) may include probable but unconfirmed cases in some counties, and (4) rates are not individual probabilities of illness. 18/19
Additional data, maps, and plots are on my tracking site - slu-opengis.github.io/covid_daily_vi….
I’ll also have a River City Data issue on Thursday, and will continue posting daily updates for the time being.
19/19
I’ll also have a River City Data issue on Thursday, and will continue posting daily updates for the time being.
19/19
Re: African Americans and rates of infection - I missed this announcement that 80% of infections since may in the City and the County have been among Black folks. This is an absolute travesty. It did not have to unfold this way. 20/19
https://twitter.com/stlcounty/status/1417587193128923138
• • •
Missing some Tweet in this thread? You can try to
force a refresh