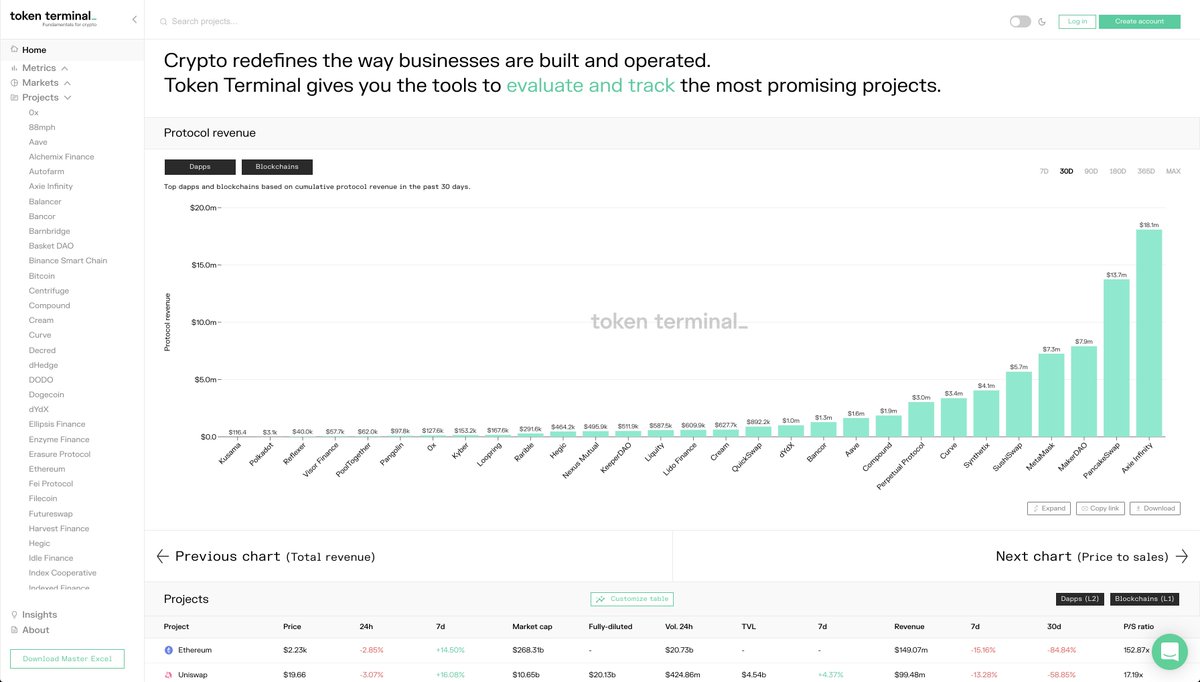
While the P/E ratio is a great starting point for cryptoasset valuation, it should not be used in isolation.
- What's driving 'E'? Token incentives / organic adoption?
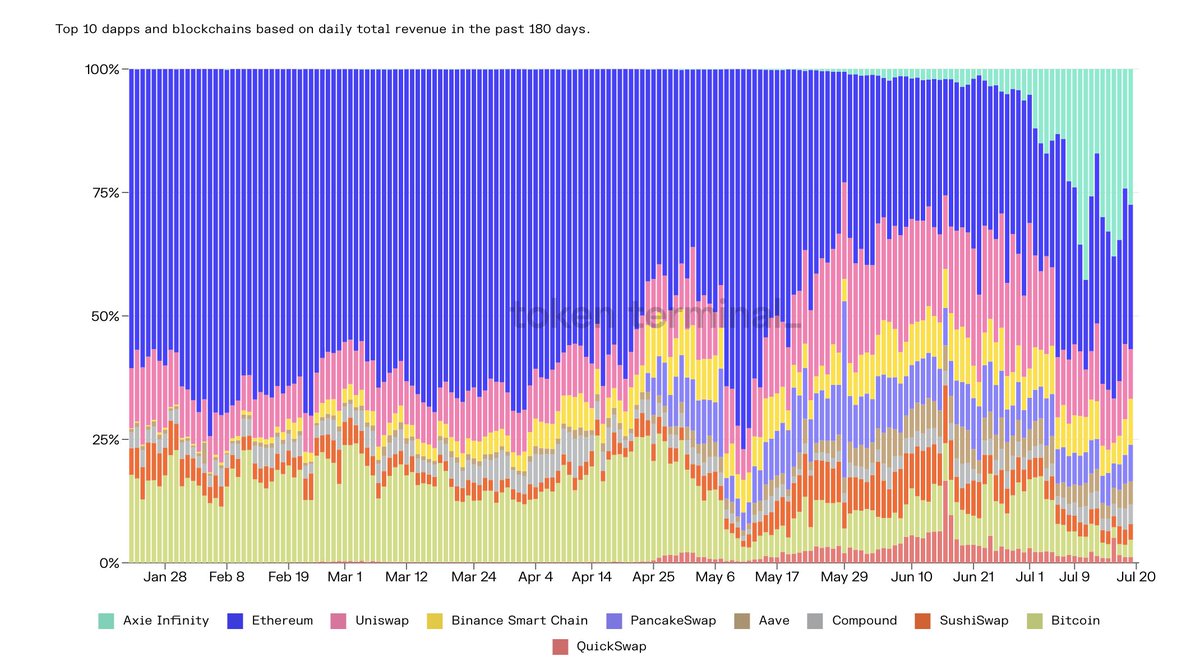
- What does the rev. composition look like? One or multiple sources?
- Is the revenue share % sustainable?
- What's driving 'E'? Token incentives / organic adoption?
- What does the rev. composition look like? One or multiple sources?
- Is the revenue share % sustainable?
https://twitter.com/0xAppodial/status/1418158319680770051
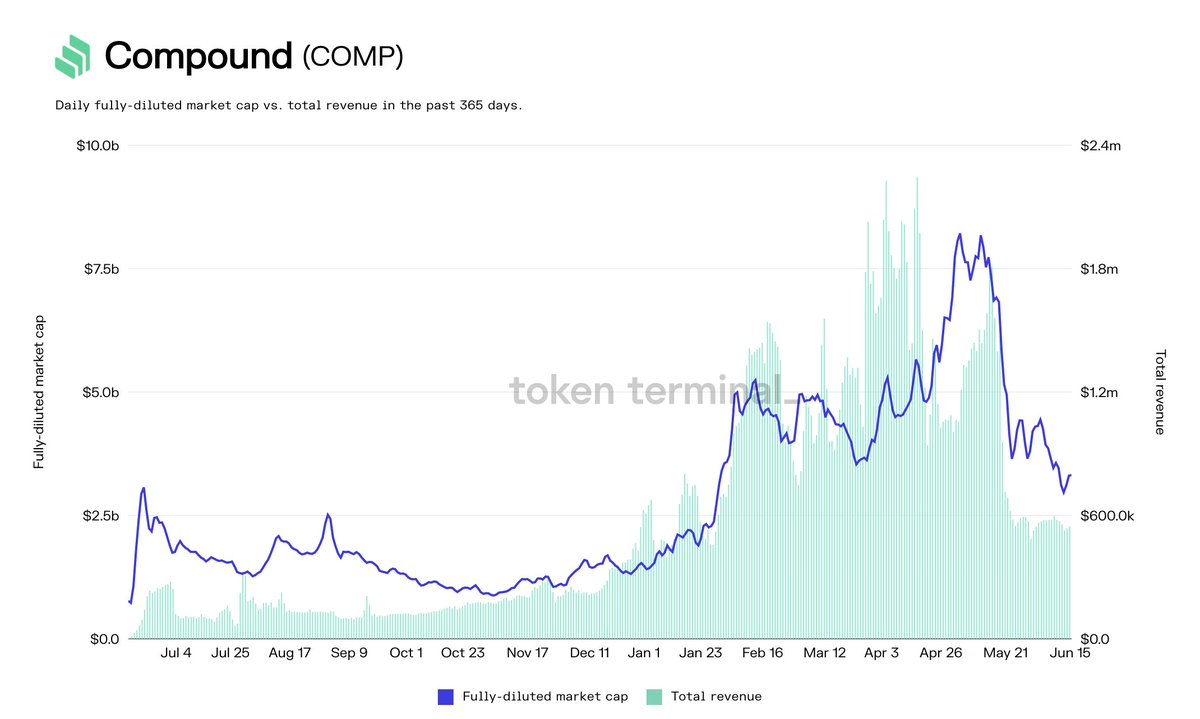
- What's driving 'E'? Token incentives / organic adoption?
Example: @compoundfinance
Currently, there's more $ paid out in token incentives vs. what's coming in as protocol revenue.
Nothing unusual for an early-stage startup, but worth being aware of.
Example: @compoundfinance
Currently, there's more $ paid out in token incentives vs. what's coming in as protocol revenue.
Nothing unusual for an early-stage startup, but worth being aware of.

- What does the rev. composition look like? One or multiple sources?
Example: @Uniswap
The long-tail of assets (other category) is driving the majority of Uniswap's (LP) revenue.
Diversity > concentration
Example: @Uniswap
The long-tail of assets (other category) is driving the majority of Uniswap's (LP) revenue.
Diversity > concentration

- Is the revenue share % sustainable?
Example: @MakerDAO
Currently, all interest payments go to the protocol (MKR holders).
Will Maker eventually have to share this revenue with CDP creators / depositors?
Example: @MakerDAO
Currently, all interest payments go to the protocol (MKR holders).
Will Maker eventually have to share this revenue with CDP creators / depositors?

• • •
Missing some Tweet in this thread? You can try to
force a refresh