My current weekly view on #Bitcoin: potential bullish engulfing candle forming after testing the 1.618 Golden Ratio of the 2018 decline. Watch this as the weekend closes on Sunday. If proves to be a bullish engulfing, this is an indication of trend reversal
(1/?)
(1/?)

(2/?)
Long-term logarithmic growth line intact since March '20, potential support as we move on.
Weekly resistance level at about $39k; $30-39k being the same price range we have been in since late May.
Weekly RSI remains mildly overbought and approaching a descending resistance
Long-term logarithmic growth line intact since March '20, potential support as we move on.
Weekly resistance level at about $39k; $30-39k being the same price range we have been in since late May.
Weekly RSI remains mildly overbought and approaching a descending resistance

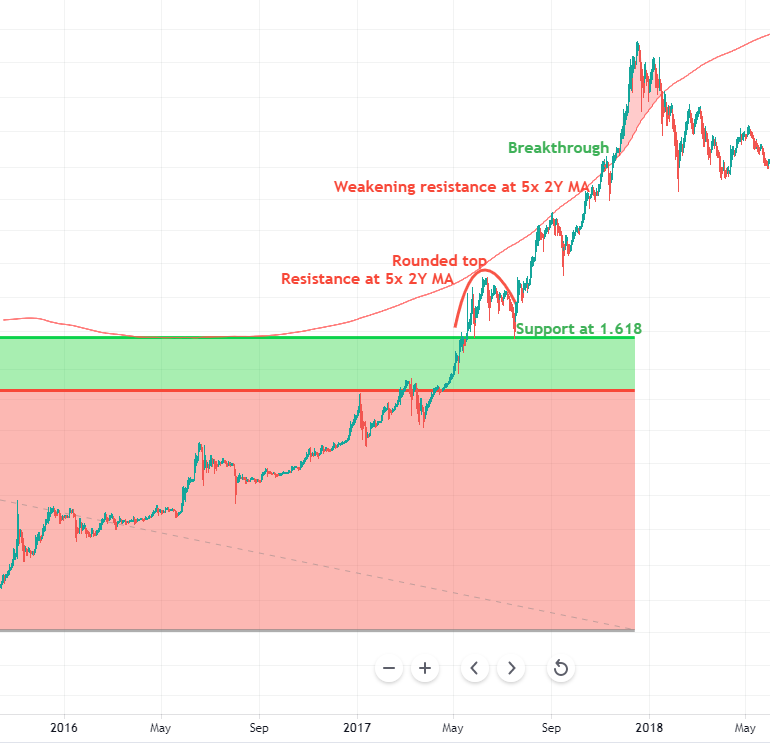
(3/?) Some context: 1.618 Golden Ratio forms a support level during a mid-summer 4th wave correction in each #Bitcoin cycle. 

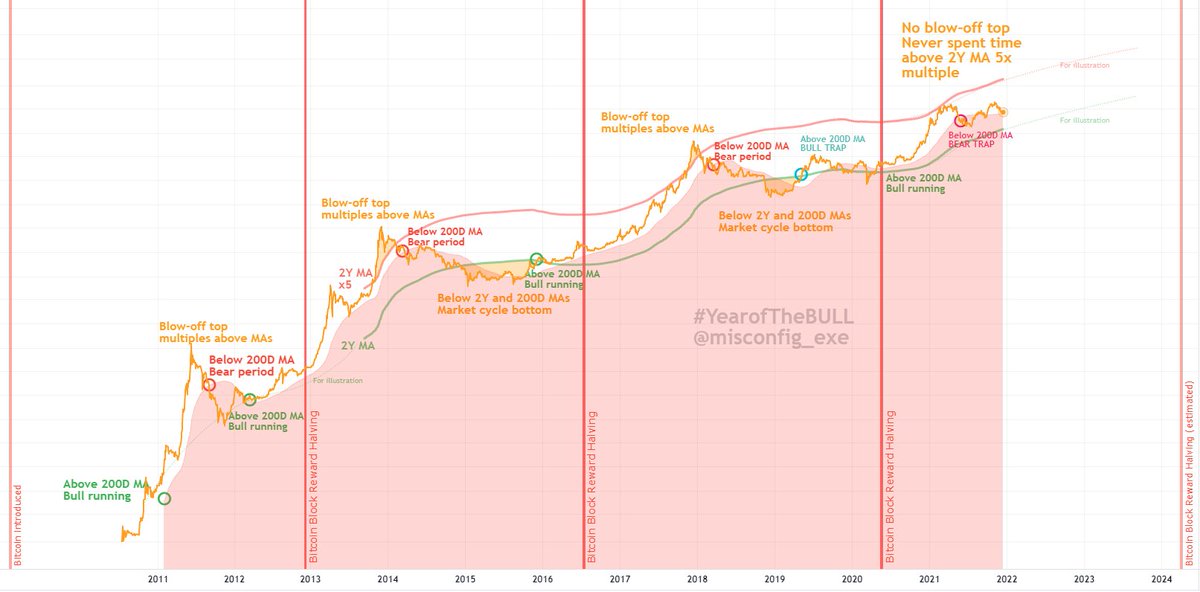
(4/?) Full context: #Bitcoin follows psychological stages of a bubble, beginning with despair, stealthily recovering, awareness phase leading to MANIA phase as GREED sets in, before a blow-off top to start over again 

(5/?)
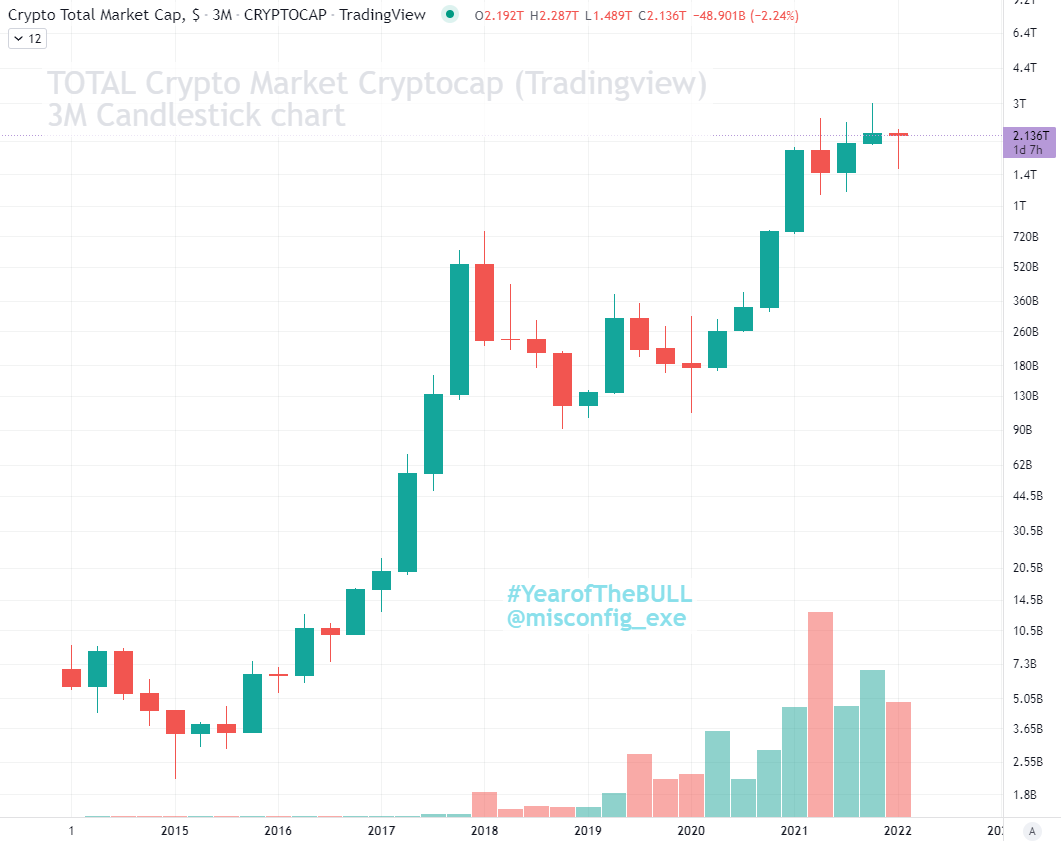
Here are #Bitcoin in 2017 and 2021 for comparison.
Note the significance of the #GoldenRatio as support during the bull run each cycle.

Here are #Bitcoin in 2017 and 2021 for comparison.
Note the significance of the #GoldenRatio as support during the bull run each cycle.


(6/?)
Remember, in 2017 the 5x 2Y MA served as resistance TWICE with rounded tops - before breaking through to GREED.
This time we have one BIG rounded top resistance.
I expect that the 2021 #Bitcoin 5th wave can be MASSIVE. I expect resistance at 2.618: ~$100k coinciding 5x2YMA

Remember, in 2017 the 5x 2Y MA served as resistance TWICE with rounded tops - before breaking through to GREED.
This time we have one BIG rounded top resistance.
I expect that the 2021 #Bitcoin 5th wave can be MASSIVE. I expect resistance at 2.618: ~$100k coinciding 5x2YMA


(7/7) And we cannot forget the MACRO environment:
UNPRECEDENTED inflation of the monetary supply.
Rising costs and prices across the board.
Reports that wages are only increasing when people change jobs.
#Inflation #BuyBitcoin #PaywithLitecoin #Bitcoin #Litecoin


UNPRECEDENTED inflation of the monetary supply.
Rising costs and prices across the board.
Reports that wages are only increasing when people change jobs.
#Inflation #BuyBitcoin #PaywithLitecoin #Bitcoin #Litecoin


@threadreaderapp unroll please
30m to #BTC weekly close. #Bitcoin looking even better than yesterday.
If you set last week's open as your bid (for a retest of descending) or a stop loss, looks to be some fantastic R/R.
If you set last week's open as your bid (for a retest of descending) or a stop loss, looks to be some fantastic R/R.

Battling for a close above $35k. Will #Bitcoin do it?
Wow, #BTC 4h chart looks great.
Tossing resistance aside. Would like to see a retest of the $35,000 level for confidence.
Tossing resistance aside. Would like to see a retest of the $35,000 level for confidence.

BEAUTIFUL bullish engulfing candle, closing above $35425 and setting the tone.
Moving forward!
#BTC #Bitcoin $BTC
Moving forward!
#BTC #Bitcoin $BTC

• • •
Missing some Tweet in this thread? You can try to
force a refresh


