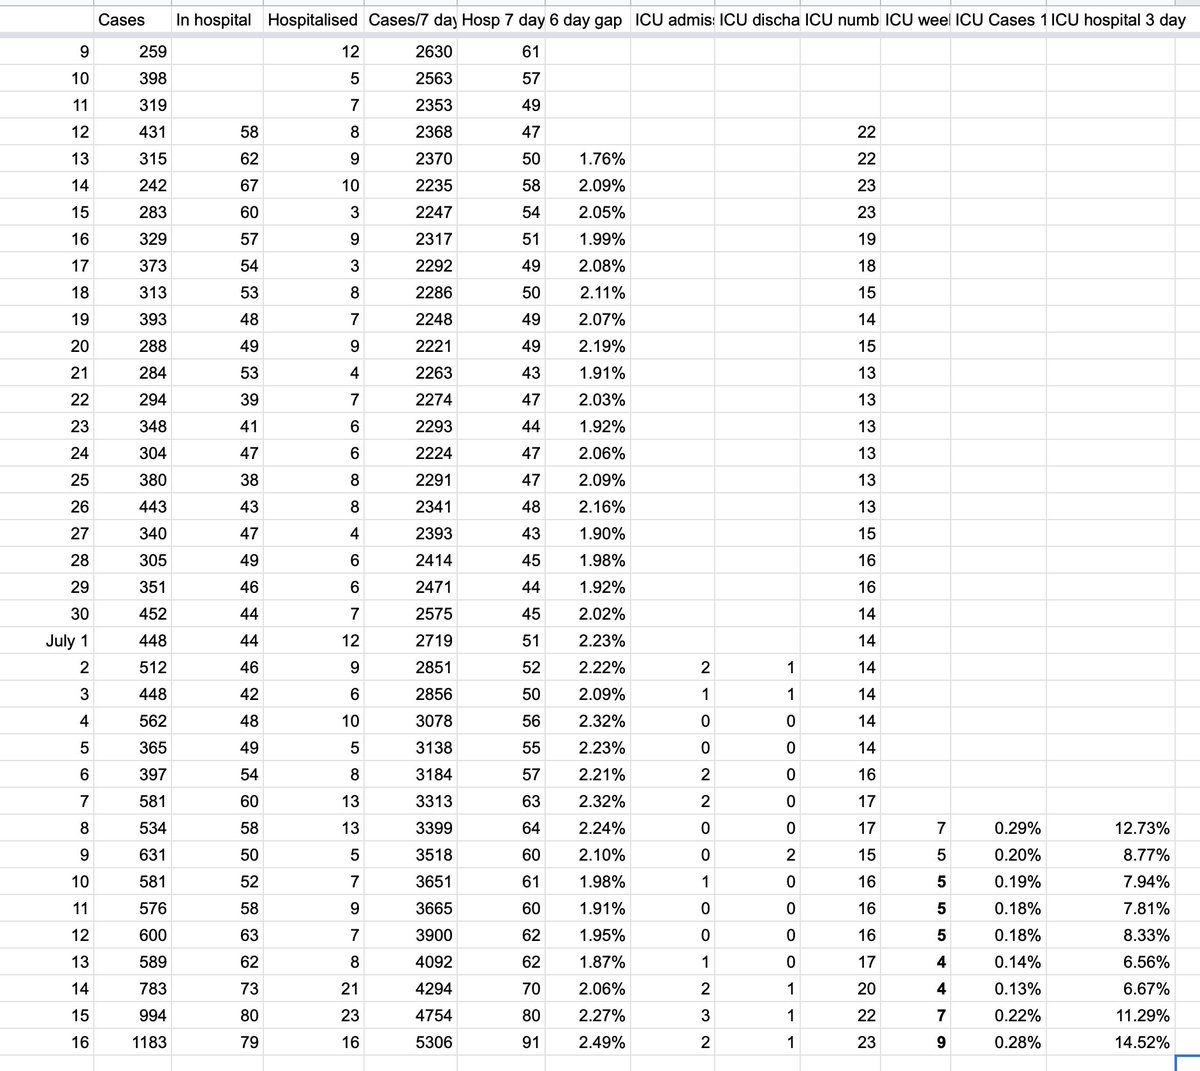
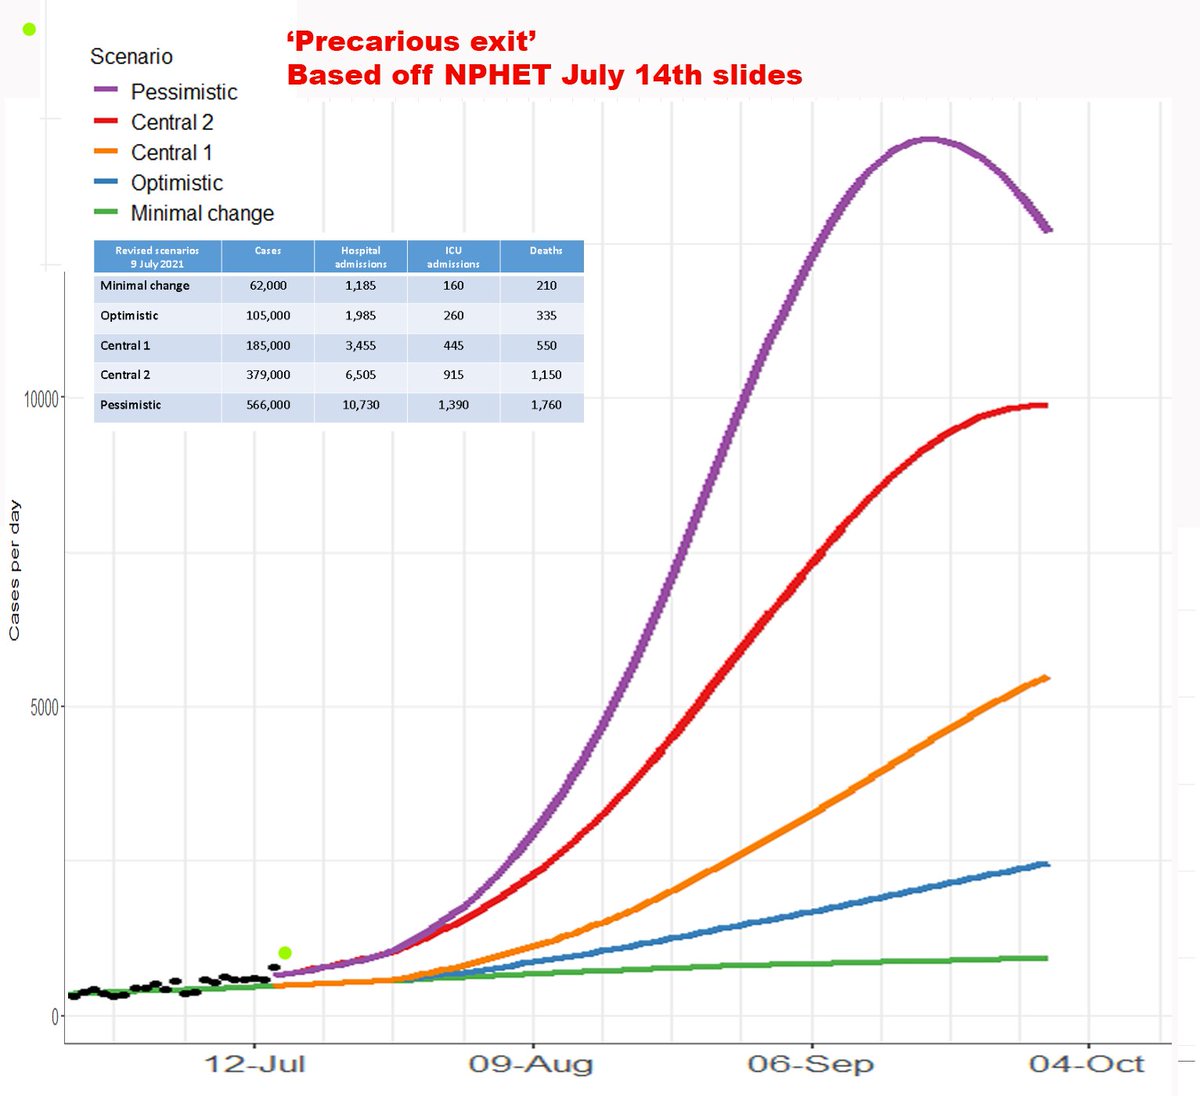
Todays 1345 cases added to the Precarious Exit plot - they are 126% last Monday with the 8879 cases this weeks at 124% of the previous week. At that rate we might get back inside NPHETs pessimistic plot before impact of opening indoors hits /1 Image
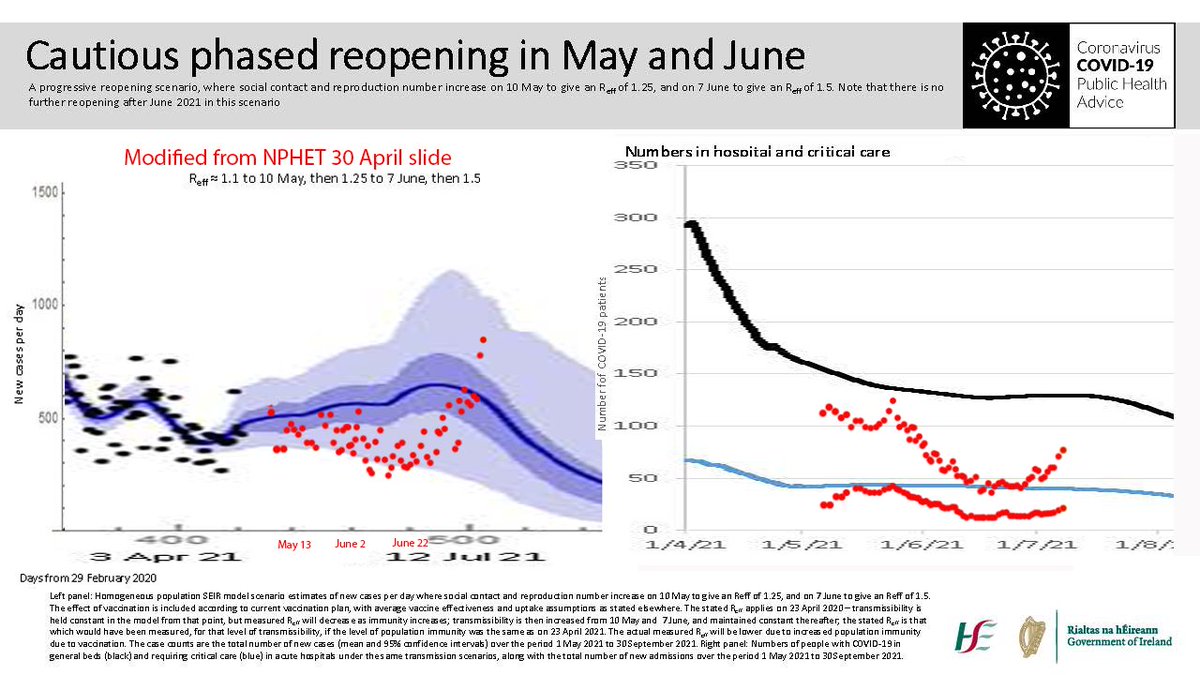
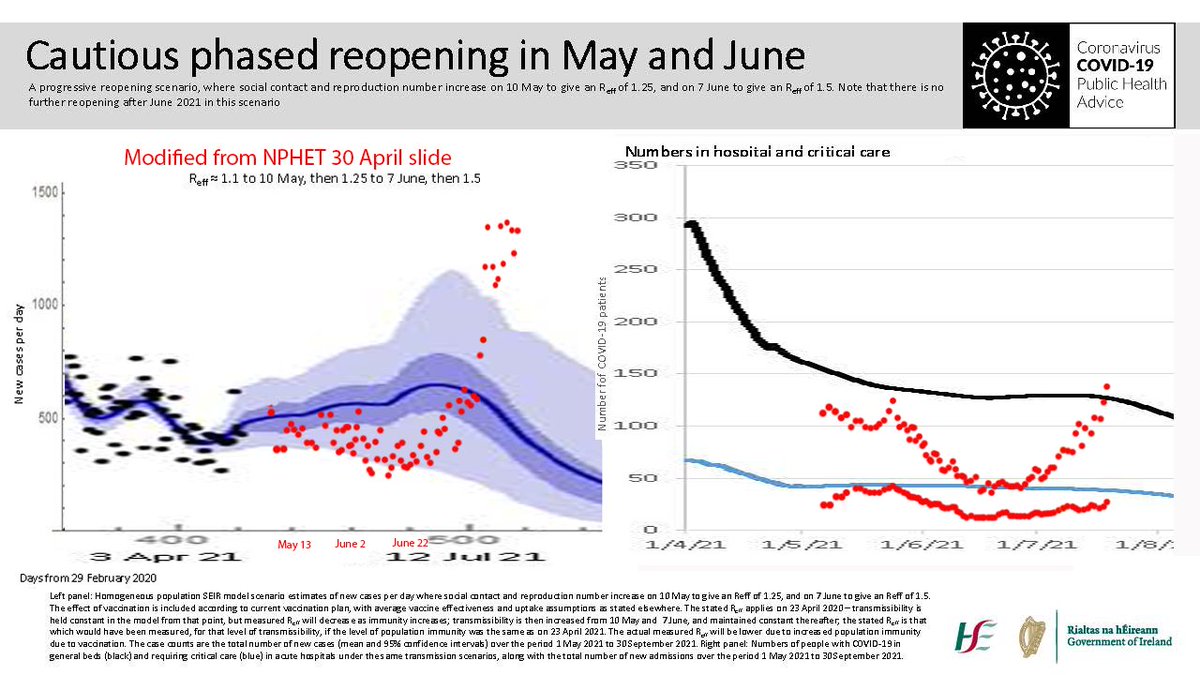
Cautious Reopening plot has not left the top of the screen as I feared last Monday for cases but hospitalisation are now above expected level for 1st time and ICU getting close to that
141 hospital is 140% last Monday
25 ICU is 125% last Monday
/2 Image
The north saw a large drop in cases today but as the cost of the rise of cases last week a big weekend increase in hospital & ICU admissions. This is starting to overwhelm other healthcare as a result /3
We are about 1/3 cares per 100k but are also seeing a rise in hospitalisations and ICU following last weeks rise in cases /5
Plugging the current stats into the outcomes calculator we get a very much less alarming picture than last Monday, however this is still a lot of people going to hospital and ICU in what are hopefully the last weeks of the pandemic. Todays opening risks that a lot worse /5 Image
Spitballing - HIT plotted against R0 is not linear. Substitute in Rt shifting according to behaviour you can see that at high vaccination levels a small shift in behaviour (eg all around to a mates to watch the football) may enlarge HIT & vice versa /6 ImageImage
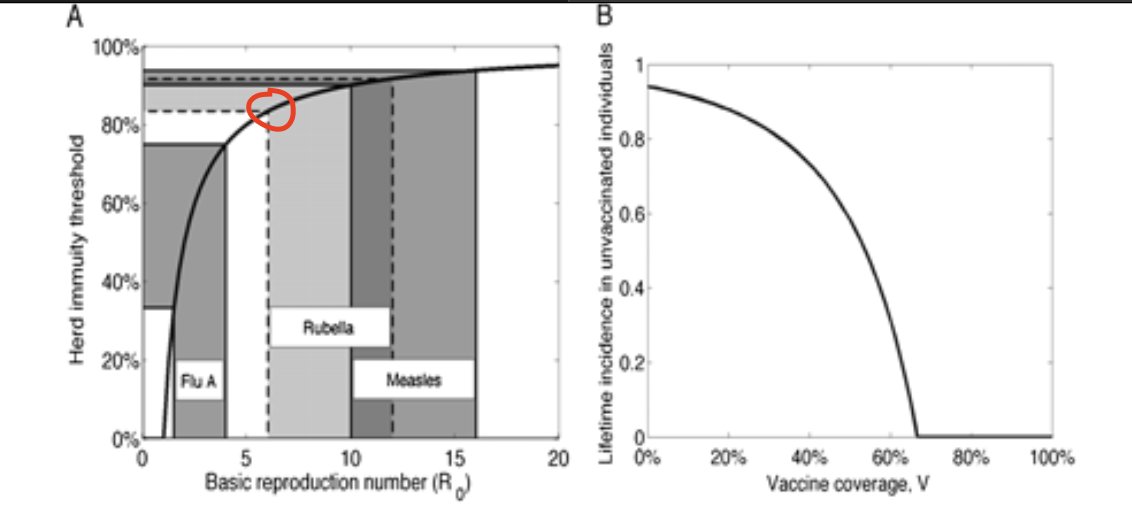
The above being a possible explanation along with other behaviour changes for the drop in cases in the north and England along with the way Scotlands dropped a week earlier

β€’ β€’ β€’

Missing some Tweet in this thread? You can try to force a refresh
γ€€

Keep Current with Andrew Flood πŸ‘¨πŸ»β€πŸ’»πŸ“πŸ•Ί

Andrew Flood πŸ‘¨πŸ»β€πŸ’»πŸ“πŸ•Ί Profile picture

Stay in touch and get notified when new unrolls are available from this author!

Read all threads

This Thread may be Removed Anytime!

PDF

Twitter may remove this content at anytime! Save it as PDF for later use!

Try unrolling a thread yourself!

how to unroll video
  1. Follow @ThreadReaderApp to mention us!

  2. From a Twitter thread mention us with a keyword "unroll"
@threadreaderapp unroll

Practice here first or read more on our help page!

More from @andrewflood

27 Jul
As I'd hoped todays 1120 cases which are 101% of last Tuesday's get us back inside the NPHET pessimistic & C2 plots. A once off football / post leaving cert surge rather than a trend made things looks very grim, now cases are elevated but which track we are on is still open /1
The rise on the left of hospitalisations & ICU shows we are paying a price for that surge - and one which will continue unless & until cases start to decrease or full adult vaccination is reached
142 hospital, 160% last Tuesday
27 ICU, 129% β€œ
/2
Currently 2% of cases are being hospitalised 6 days later & 15% of hospital cases are in ICU 3 days later/ Completing adult vaccination is all that is likely to cut those percentages substantially as those are near the rates for young unvaccinated /3
Read 10 tweets
27 Jul
A 6% gender gap in the HPSC 14 day data points to a similar effect in Ireland - presumably men going to the mate with the biggest screens house to watch the matches. Adds hope that the recent slowing of the rate of case rise is real ft.com/content/cb86d9…
I’m also hopeful that we are seeing a hint of a population immunity threshold being reached as behaviors changed post Euros - in England opening nightclubs may well flip that back again with a case rise towards the end of this week but if anything that would confirm this
With a similar level of vaccination as the UK if lower level of survival immunity (as we have about 1/2 the deaths per 100k) that *might* make the recent opening sustainable within a couple of weeks more vaccination
Read 5 tweets
26 Jul
I’d be pretty cynical about what Leo & the lobbyists are up to in choosing to suggest Covid isn’t so much of a threat as hospitalizations suggest on the day indoor hospitality opens. Average stay is 6 days & 10% are still ending up in ICU 3 days post hospitalization
Im tracking all the hospital related stats in this thread - it is complex & given this now being the weak sauce for conspiracy theorists better quality data direct from the HSE would be useful
Given the case surge of a week back it’s likely we are about to see a surge in hospital numbers this week - perhaps this downplaying exercise is the politicians seeking to get ahead of that news
Read 6 tweets
25 Jul
Todays #Covid19Ireland Precarious Exit plot confirming my senses yesterday that with the rate of case growth slowing we would return to NPHET worst case curve, a big improvement on last week. Todays 1126 cases, added as green dot, are in fact just 96% of last Sundays /1 Image
The older Cautious Reopening plot reveals on left just how badly Delta wrecked hopes of earlier escape from the pandemic. And today hospital cases has risen to what had been expected but moving in the wrong direction
123 Hospital is 135% last Sunday
22 ICU is same as last Sun /2 Image
New hospital cases remain linked to case increases when you allow for a 6 day lag & ICU admissions remain linked to the hospital cases with 3 more days lagged. But at a lower proportion than before, 2% rather than 5% /3
Read 9 tweets
16 Jul
Sigh - this was not how I hoped the #Covid19Ireland Cautious Reopening plot would end but the last 3 case dots tell a story thats sadly unmistakable - adding as the final red dots
1183 cases is 187% of last Friday
79 hospital, 158% last Friday
23 ICU, 153% last Friday
/1
What happens next will be tracked on the Precarious Exit plot which has not improved since yesterday, indeed the 5306 cases this week being 151% of the previous week is. a lot worse, I'll show how much in the next 2 tweets /2
I've been tracking what percentage of cases end up in hospitals and what percentage of those go to ICU. As the force of infection increased these have got a lot worse, 2.5% cases hospitalised & almost 15% of those going to ICU when you account for lag effects. /3
Read 11 tweets
15 Jul
With almost 1000 cases a day it's clear the Cautious Reopening is now off the rails & in next tweet I have a new plot. But added today as red dots
994 cases, 186% last Thursday
80 hospital, 138% "
22 ICU, 129% "
/1
New plot using the NPHET scenarios to track what I'm calling the Precarious Exit. Cases added as bright green dot, you'll note we are already doing worse than the worst case NPHET presented yesterday. Next tweet I look at how much worse /2
We have had 4754 cases in week which is 140% last week- project forward at that rate to end September & we have 840k cases accumulate, 19k hospitalised at current rate of 2.3% cases
4294
6012
8416
11783
16496
23094
32332
45265
63370
88719
124206
173888
243444
/3
Read 9 tweets

Did Thread Reader help you today?

Support us! We are indie developers!


This site is made by just two indie developers on a laptop doing marketing, support and development! Read more about the story.

Become a Premium Member ($3/month or $30/year) and get exclusive features!

Become Premium

Too expensive? Make a small donation by buying us coffee ($5) or help with server cost ($10)

Donate via Paypal Become our Patreon

Thank you for your support!

Follow Us on Twitter!

:(