Three weeks after this tweet from Sep 2019, the Fed began buying UST (US Treasuries) in October 2019, before the pandemic, and nearly two years later hasn't stopped yet. 🧐
If Dalio's conception of the long-term debt cycle is the biggest breakthrough I saw for understanding the current economic environment years ago, Luke's summer 2019 interview with Ed Harrison is probably what dialed it in for me for timing and details:
• • •
Missing some Tweet in this thread? You can try to
force a refresh
All the folks who were tweeting out year-over-year M2 growth rate charts several months ago aren't tweeting them anymore, since the charts are less sensational, so I'll do it.
M2 YOY % change is down to about 13%, from a peak of 27%.
I highlighted this effect since last year, where the rate after the crazy March/April 2020 period is a more modest "only 13%" growth rate. My chart from back then:
The rate of ongoing M2 expansion will largely depend on fiscal decisions.
As I've pointed out, this period is more like the 1940s, not the 1970s, and so money supply growth is primarily about fiscal spending, not bank lending. lynalden.com/may-2021-newsl…
The global monetary system built around the dollar currently relies on the US running persistent trade deficits with the rest of the world, and benefits the US corporate class over the US worker class, which is part of why it's gradually losing steam. lynalden.com/fraying-petrod…
The other reason it's losing steam is that the US is becoming a smaller share of global GDP over time, and with sanctions it is starting to incentivize strategically important countries (ie those with oil and nukes) to de-dollarize and diversify their currency usage.
The numbers speak for themselves as to how the current monetary system is not working for 90% of the US anymore:
My latest public article discusses the global energy market, including an overview of why it's rather difficult to replace fossil fuels in practice. lynalden.com/oil-and-gas/
When we think about new energy sources, we often envision pervious ones being replaced. Like this chart, that shows the percentage of total energy consumption that each energy type is responsible for:
However, in absolute terms, new energy sources tend to be additive to previous energy sources.
The world as a whole has never previously phased out primary energy sources in absolute terms, or downgraded the energy density of its primary energy sources. So, that's not trivial.
On one hand, people let out thoughts or aggressions online that they would be less prone to do in person. It helps get a feel for what people "really" think.
On the other hand, people are social animals with instincts and bonds. Online diminishes those, leaving the rough side.
Folks develop "internet enemies" that if they were to meet in person and get to know each other a bit, might be more respectful even if they naturally disagree.
Internet enemies have all the natural disagreements, without the million years of empathy instincts as social animals.
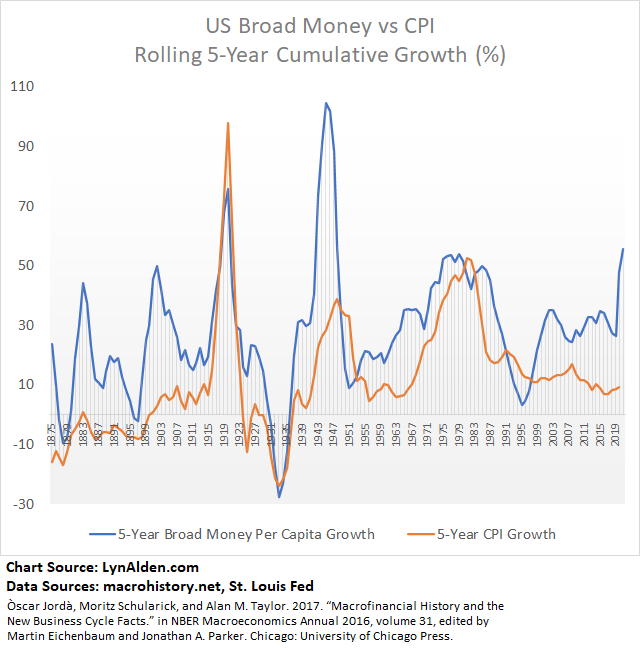
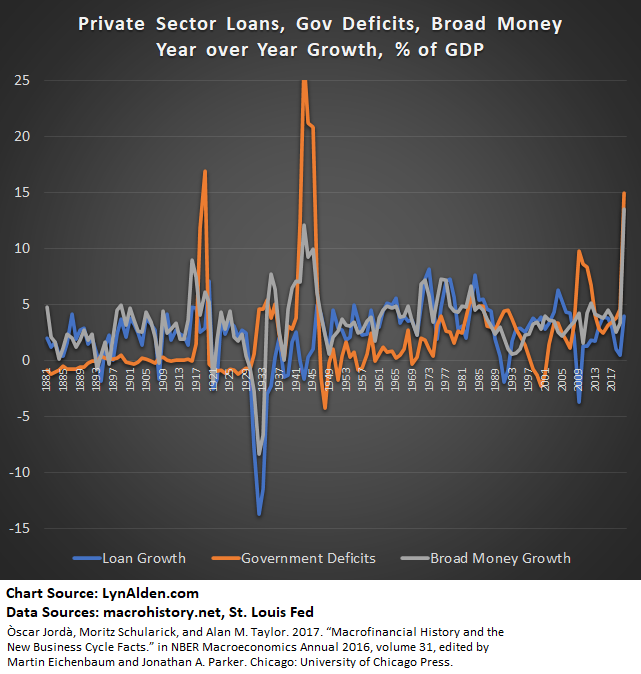
Broad money growth generally occurs in one of two ways: either banks lend and create deposits (and thus increase the money multiplier, M2/MB) or when bank lending seizes up, governments run large deficits and go around the bank lending channel.
A thread.
Looking at 140 years of data, we see periods where loan growth fueled broad money growth (late 1800s, 1920s, 1950s, etc), periods where fiscal deficits fueled broad money growth (1940s), and periods like the 1970s/1980s where both lending and deficits fueled broad money growth.
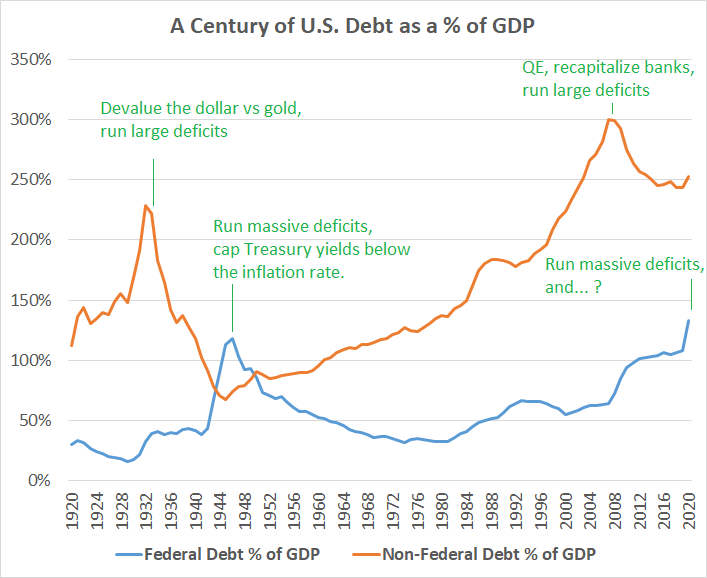
The 1940s are interesting because they are most analogous to the 2020s. After a large private debt bubble partial deleveraging (1930s and 2010s), a period of economic stagnation and external catalyst eventually resulted in a massive fiscal response (1940s and 2020s).