8/1 Texas C19 Pos%, Case, Hosp & Fatality update:
THREAD:
#Casedemic continues. Good day for pos% & cases. Hospitalizations continue to track below 2020, and fatalities running increasingly behind 2020.
1/n
THREAD:
#Casedemic continues. Good day for pos% & cases. Hospitalizations continue to track below 2020, and fatalities running increasingly behind 2020.
1/n
https://twitter.com/therealarod1984/status/1421565952152555521
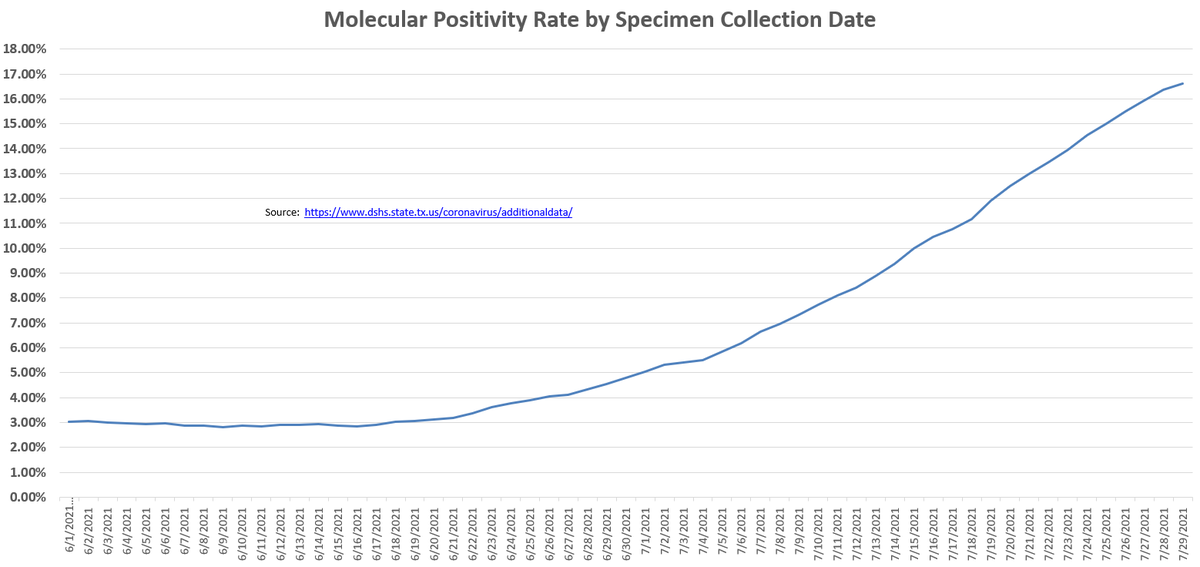
Positivity Rate:
Could be the weekend, but both positivity rates show a peak and the start of a decline. Moreso Antigen, but PCR as well. We will watch the next couple of days to see if this solidifies or if its just weekend reporting. Possible good news though.
2/n
Could be the weekend, but both positivity rates show a peak and the start of a decline. Moreso Antigen, but PCR as well. We will watch the next couple of days to see if this solidifies or if its just weekend reporting. Possible good news though.
2/n


.
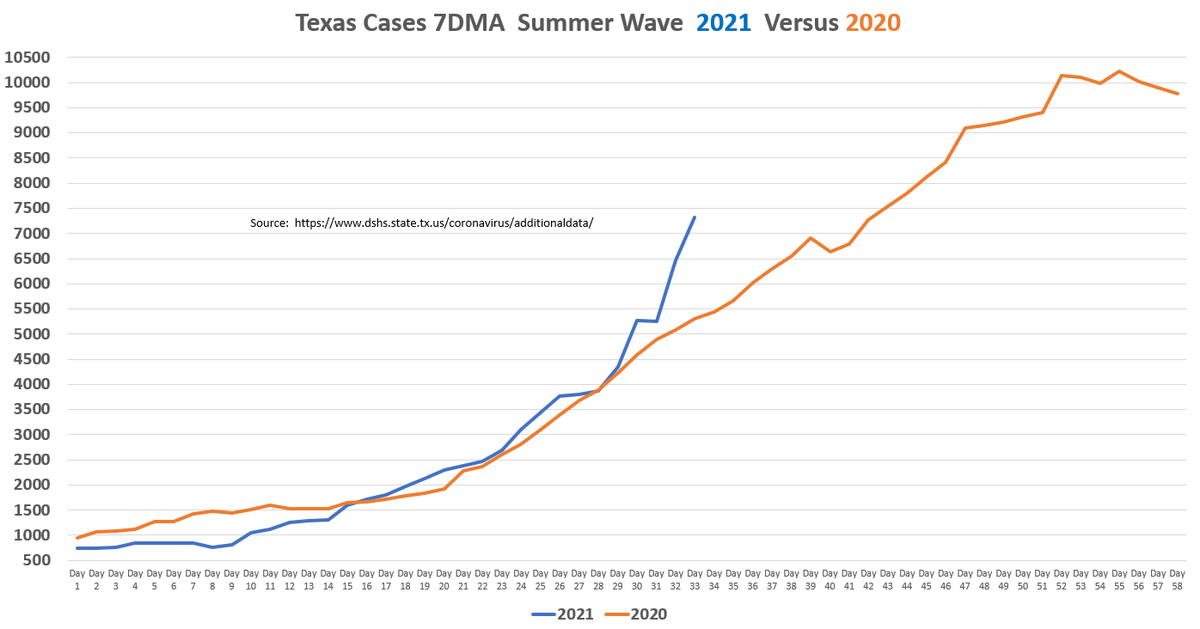
8/1 Cases:
Better day. Basically the same week over week as last Sunday. So the 7DMA is flat. Still way ahead of 2020 Summer wave pace, however.
If we go by 2020, the case wave will peak in about 17 days. We watch.
3/n
.
8/1 Cases:
Better day. Basically the same week over week as last Sunday. So the 7DMA is flat. Still way ahead of 2020 Summer wave pace, however.
If we go by 2020, the case wave will peak in about 17 days. We watch.
3/n
.


8/1 Hospitalizations:
C19 Hosps reach 10% of all available beds. Remember that - 10%.
2021 Summer wave continues to lose ground to the 2020 Summer wave, with a flatter curve. Especially ICU beds, which are running 18% lower than last year, at same point in wave.
4/n
C19 Hosps reach 10% of all available beds. Remember that - 10%.
2021 Summer wave continues to lose ground to the 2020 Summer wave, with a flatter curve. Especially ICU beds, which are running 18% lower than last year, at same point in wave.
4/n


8/1 Fatalities Part 1:
* Primer for background info in 7/n
* 2021 Summer Wave projected fatalities are running 17% behind 2020, and actual fatalities are running 29% behind 2020.
* I will update projections again in 2 days, and will be projecting mostly downward.
5/n
.
* Primer for background info in 7/n
* 2021 Summer Wave projected fatalities are running 17% behind 2020, and actual fatalities are running 29% behind 2020.
* I will update projections again in 2 days, and will be projecting mostly downward.
5/n
.


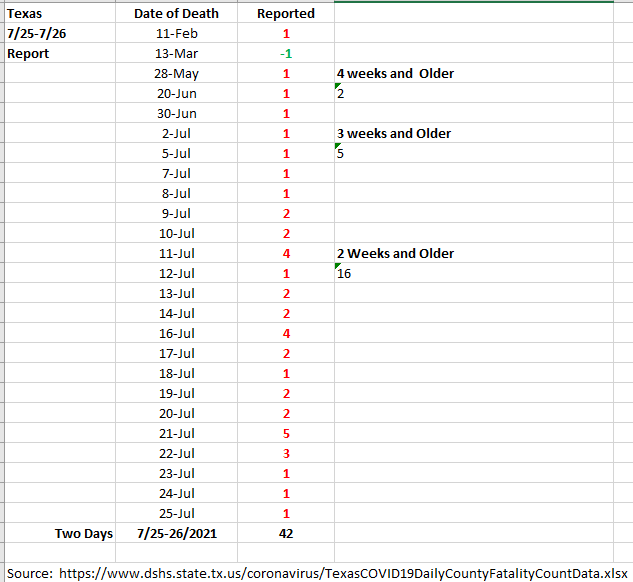
8/1 Fatalities Part 2:
* 21 Fatalities reported. Only 5 that were + 2 weeks.
* 1st half of July not filling in that ever increasing divergence between fatalities and hospitalizations.
* This C19 summer wave is so far not nearly as lethal as 2020's summer wave.
6/n
.
* 21 Fatalities reported. Only 5 that were + 2 weeks.
* 1st half of July not filling in that ever increasing divergence between fatalities and hospitalizations.
* This C19 summer wave is so far not nearly as lethal as 2020's summer wave.
6/n
.


Primer for background info on Fatality computations and modeling, and why I'm asserting 2021 is not as lethal as 2020...
7/n
.
7/n
.
https://twitter.com/therealarod1984/status/1421091537136623617?s=20
8/1: Conclusion:
* Antigen pos% again has peaked, &7 PCR may have as well.
vs. the 2020 Summer Wave, 2021 Delta wave:
* Cases are higher
* Hospitalizations lower & curves flatter
* Fatalities significantly lower
* Case & Hosps peak are about 2 weeks out. Almost there.
8/end
* Antigen pos% again has peaked, &7 PCR may have as well.
vs. the 2020 Summer Wave, 2021 Delta wave:
* Cases are higher
* Hospitalizations lower & curves flatter
* Fatalities significantly lower
* Case & Hosps peak are about 2 weeks out. Almost there.
8/end
• • •
Missing some Tweet in this thread? You can try to
force a refresh