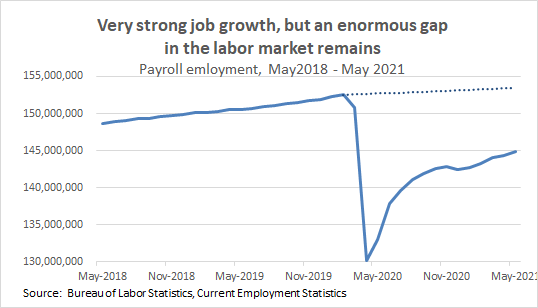
The labor market added 943,000 jobs in July, huge job growth far surpassing expectations. There were also upward revisions to earlier data, bringing the three month average to 832,000, also huge. 1/
There is still a big gap in the labor market, but even with some slowing from this pace of job growth, we will be back to pre-COVID health by the end of 2022—a recovery *five times* as fast as the recovery following the Great Recession, thanks to the vaccine and to the ARP. 2/ 

The unemployment rate dropped from 5.9% to 5.4%, and all for “good” reasons—both the labor force participation rate and (especially) the employment-to-population ratio rose. People are finding work. 3/
Leisure and hospitality grew by 380,000 in July. Over the last four months, leisure & hospitality has added 1.4 million jobs—half of the 2.8 million total jobs added over that period. Can we put all the talk of a huge damaging labor shortage to rest NOW? 4/
A key footprint of labor shortages is wage growth. Employers who face true shortages of workers will respond by bidding up wages to attract those workers, and employers whose workers are being poached will raise wages to retain their workers, and so on. 5/
The aggregate wage growth measures released today are problematic due to pandemic composition effects. To address that, you can look at the wage growth of relatively homogenous groups: production and nonsupervisory workers, by sector. 6/
Looking at wage growth of nonsupervisory workers by sector, you do NOT see evidence of widespread labor shortages in today’s labor market. In the vast majority of sectors, wages are roughly what you’d expect if COVID hadn’t happened. Seriously, look at this chart. 7/
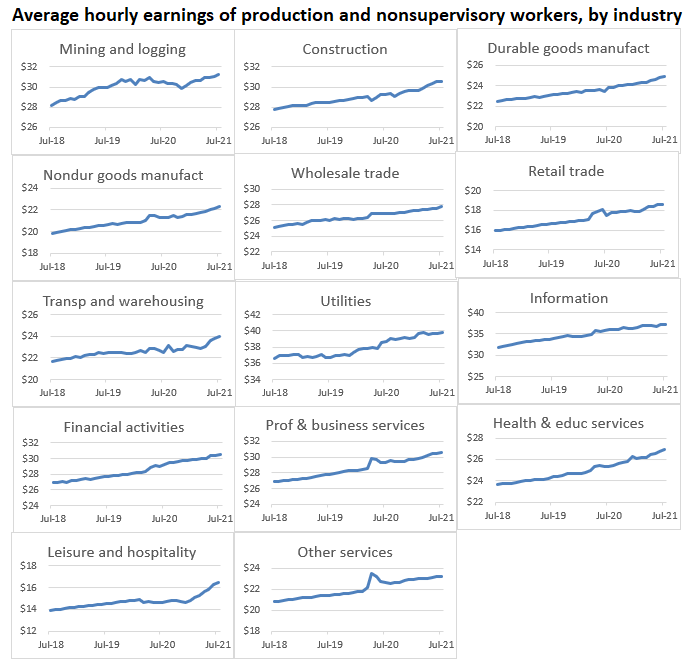
Careful chart readers will notice that one key exception is leisure & hospitality, where wages have risen sharply enough to suggest an actual (if sector-specific) shortage. But when you look further, you find little to be concerned about. 8/
First, wage growth in leisure and hospitality doesn’t appear to have held back job growth at all. Job growth in that sector has been *by far* the strongest of any major sector (adding 2.1 million jobs over the last six months!) 9/
And, weekly wages for typical workers in leisure and hospitality translate to annual earnings of $21,668, far (far) lower than in other sectors, even with the recent acceleration. Those increases are not going to create broad wage pressure. 10/
Another key measure of economy-wide wage growth that controls for composition effects—the Atlanta Wage Growth Tracker—also does not show strong economy-wide wage growth. 11/ atlantafed.org/chcs/wage-grow…
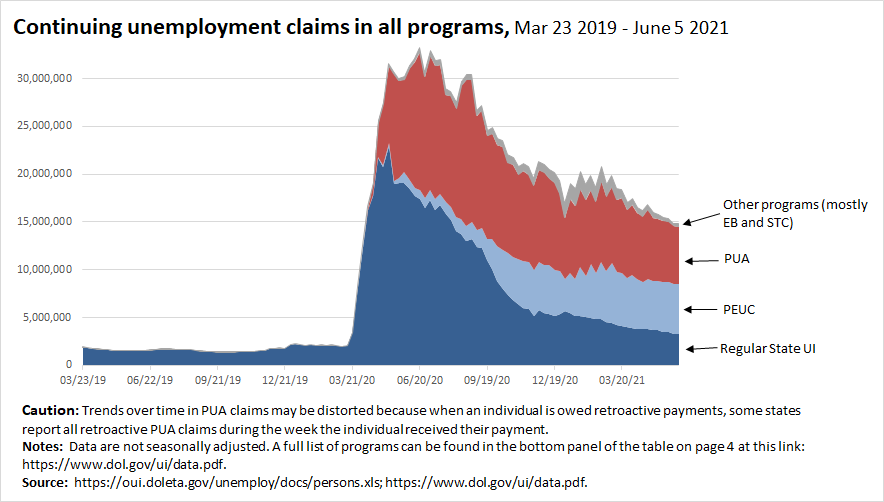
Note, today’s data don’t tell us anything about the impact of states cancelling pandemic unemployment insurance benefits, since state breakdowns are not provided in today’s data release. 12/
However, most available data do not find that canceling UI benefits is increasing employment, consistent with earlier evidence that pandemic UI benefits were not keeping people out of the labor market en masse. 13/
https://twitter.com/p_ganong/status/1423483873745309697
Seasonally adjusted job growth in State & Local govt was very strong in July (+222,000) but we need much, much more. We're still down 807,000 S&L govt jobs since Feb ‘20—much of that, 375,000, in education. It’s crucial S&L governments use their ARP funds to refill those jobs.14/
Overall numbers mask large disparities. Our history & present of systemic racism hugely affect the labor market. B/c of occupational segregation, discrimination, & other disparities rooted in white supremacy, this crisis has hit people of color far harder than white workers.15/
The disparities are stark: In July, the Black unemployment rate was 8.2%, the Latinx unemployment rate was 6.6%, the Asian unemployment rate was 5.3%, and the white unemployment rate was 4.8%. 16/
At 5.4%, the overall unemployment rate is still elevated—and we have to remember that *the unemployment rate is not counting all coronavirus-related labor market pain*. (Note: this is always true following recessions, but it is especially true now.) 17/
In July, there were 8.7 million workers who were officially unemployed. But there were an additional 420,000 workers who were temporarily unemployed but who were being misclassified as “employed not a work.” 18/
Further, the number of workers who were out of work as a result of the virus but were being counted as out of the labor force instead of as unemployed because they weren’t actively seeking work was 4.3 million. 19/
If all these workers were taken into account, the unemployment rate would have been 8.1% in July, instead of 5.4%. 20/
Usual caveat: This does not mean @BLS_gov is cooking the books. BLS is completely transparent and provides all the information needed (and more!) to do these kinds of calculations. 21/
Fascinating chart showing seasonal adjustment quirks
https://twitter.com/DanielBZhao/status/1423630100461989896?s=20
One important point: today’s release covers data from mid-July, so it doesn’t capture the effect of the increase in COVID cases in recent weeks. That may slow things down somewhat, but I don’t expect to see major slowing unless we get a vaccine-resistant strain of the virus. 23/
• • •
Missing some Tweet in this thread? You can try to
force a refresh