Last week 599,000 people applied for UI. This included 498,000 who applied for regular state UI (seasonally adjusted) and 101,000 who applied for Pandemic Unemployment Assistance (PUA). 1/ dol.gov/ui/data.pdf
Claims are high but moving in the right direction. The 599,000 who applied for UI last week was a decrease of 112,000 from the prior week. The 4-week moving average of total initial claims decreased by 74,000. 2/
Total initial claims are still three times what they were before COVID. (If you restrict to regular state claims—because we didn’t have PUA pre-COVID—initial claims are 2.5 times where they were before COVID.) 3/
This chart shows continuing claims in all programs over time (the latest data for this are for April 17). Continuing claims are declining but are still over 14 million above where they were before the virus hit. 4/
Many are asking whether expanded unemp benefits are keeping workers from taking jobs. There was also a lot of fuss about this questions last May/June/July, when workers were getting a $600 additional weekly benefit and, like now, we were adding jobs at a breathtaking pace. 5/
There were several rigorous papers that looked at the impact of the $600, and found extremely limited labor supply effects. If the $600 a week wasn’t keeping people from taking jobs then, it’s hard to imagine that a benefit *half* that large is having that effect now. 6/
Pandemic UI provisions will expire Sept 6, when—even in the best case scenario—unemployment will still be elevated. The workers of this country need fundamental UI reforms that include automatic triggers based on economic conditions. 8/
One other point about today’s UI release: continuing claims dropped by more than 2 million between the March and April reference weeks for tomorrow’s jobs numbers. That’s consistent with the predictions out there for big April jobs gains. 9/
• • •
Missing some Tweet in this thread? You can try to
force a refresh
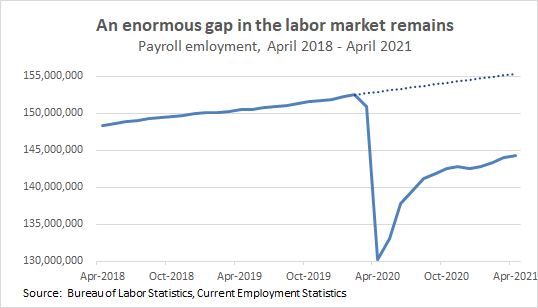
The labor market added 266,000 jobs in April, solid growth but far below expectations. Growth in March was also revised down. Further, we still have 8.2 million fewer jobs than we did before the recession, in February 2020. 1/
And, that 8.2 million is not the total gap in the labor market. Pre-COVID, we were adding about 200,000 jobs a month. At that pace, we would have added 2.8 million jobs in the last 14 months, so the total gap in the labor market right now is around 8.2 + 2.8 = 11 million jobs. 2/
Do today’s data reveal whether there is anything behind anecdotal claims of worker shortages, particularly in restaurants? (As background, here’s my thread explaining why I’m quite skeptical of claims of widespread labor shortages.) 3/
There are certainly a lot of anecdotal reports right now of employers not being able to find the workers they need, particularly in restaurants. But unemployment is still very elevated—particularly among restaurant workers. What’s going on? 1/
First, remember there is *always* a chorus of employers who claim they can’t find the employees they need. One reason for that is that in a system as large and complex as the U.S. labor market there will always be pockets of bona fide labor shortages at any given time. 2/
But a more common reason is employers simply not wanting to raise wages high enough to attract workers. Employers post their too-low wages, can’t find workers to fill jobs at that pay level, and claim they’re facing a labor shortage. 3/
Welp I was just the person testifying at a congressional hearing who had to be told she was on mute.
This is a hearing on the minimum wage and omg before this I had mistakenly let myself believe that the myth that min wage workers are teenagers had been debunked.
PEOPLE. Only ONE IN TEN workers who would benefit from a $15 min wage in 2025 are teenagers.
Wow there is a lot of confusion about the impact of minimum wage increases on prices. The facts: it is true that *some* of the impact of minimum wage increases is passed along in the form of higher prices. 3/
Today is the last #JobsDay with data from the Trump Administration (today’s data are from mid-January). So what does the economy former President Trump handed off to President Biden look like? It’s bleak. 1/
The labor market added just 49,000 jobs in January. And that's likely too rosy—given low seasonal hiring in the pandemic, seasonal adjustments likely made the December numbers look worse than they really were and are making the January numbers look better than they really are. 2/
The average job change of the last three months provides a better sense of current movements, and it was just 29,000. We have 9.9 million fewer jobs than we did before the recession. At *this* pace it would take 29 years to get back to prerecession jobs levels. 3/
Another 1.1 million people applied for UI last week, including 779,000 who applied for regular state UI and 349,000 who applied for Pandemic Unemployment Assistance (PUA). 1/ dol.gov/ui/data.pdf
The 1.1 million who applied for UI last week was a decrease of 88,000 from the prior week, but the four-week moving average of total initial claims ticked up by 51,000. 2/
Last week was the 46th straight week total initial claims were greater than the worst week of the Great Recession (GR). (If you restrict to regular state claims—b/c we didn’t have PUA in the GR—initial claims last week were still greater than the third-worst week of the GR.) 3/
This morning BLS released 2020 data on unionization, and it is fascinating. A thread. 1/ bls.gov/news.release/u…
In 2020, 15.9 million workers in the U.S. were represented by a union—a decline of 444,000 from 2019. However, there was an *increase* in the unionization *rate* in 2020, from 11.6% to 12.1%. WHAT. 2/
In a nutshell, union workers saw less job loss than non-union workers in the pandemic. 3/