Juliette O'Brien Profile picture
Aug 8, 2021 β€’ 8 tweets β€’ 4 min read β€’ Read on X
NSW Wild TBDs - status confirmed 🧡1/8

Each day ~30-40% of new cases are Wild TBD

Surveillance reports fill in the blanks but the data is 2-3 weeks old

Here's what they tell us ...

1. High Risk / Full Wild (daily) -

#COVID19nsw #covidnsw #COVID19Aus
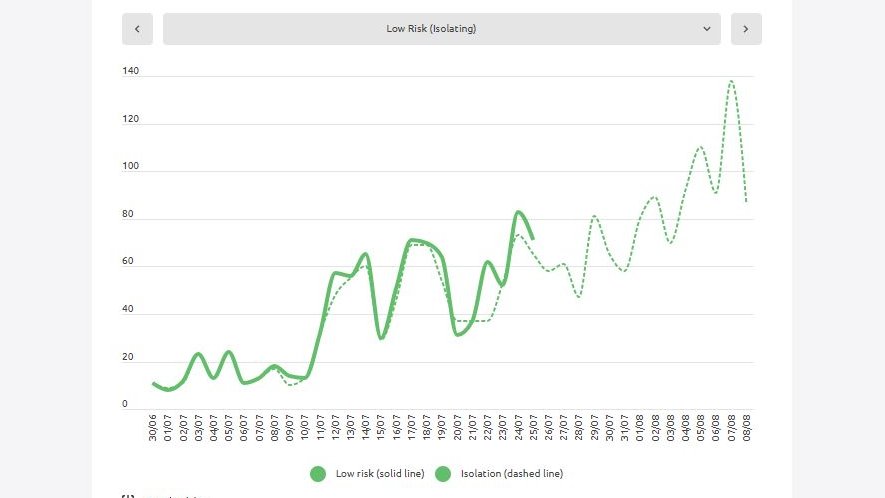
2/8. These charts show data from 2 sources -

- Surveillance report (solid line)
- Daily announcements - pressers / tweets (Dashed line)

The solid line extends to 25/7 (latest date in surveillance reports)

The dashed line extends to today

2. Medium Risk / Part Wild (daily) -
3/8. Surveillance Reports categorise Wild data as follows:

- High risk
- Medium risk
- Low risk

These fit perfectly with the 3 categories we use:

- Full wild
- Part wild
- Isolation

3. Low Risk / Isolation (daily) -
4/8. What can we see?

The solid lines show us that once case interviews have been done, there are upwards revisions to all 3 categories

They're fairly evenly distributed

4. High + Medium Risk / Full + Part Wild (daily) -
5/8. So the fact that a case is Wild TBD doesn't mean it's more likely to be Wild

BUT ...

The charts above cover the period *before* Wild TBDs exploded

The chart below shows the period covered by surveillance reports so far

The next period has many more Wild TBDs -
6/8. Upshots / takeaways ...

For the time being, it seems safe / logical to think of the cases with Wild status confirmed as a fairly accurate sample

The distribution we *can* see is probably similar to the distribution down we *can't* see
7/8. For that reason, I'm going to include a sample analysis in the daily reporting

This should help us make an educated guess about the Wild TBDs

8/8. Of course, this could change

The next surveillance report will cover a period with many more Wild TBDs. When we see that, we'll know more

It should come out on Thursday

β€’ β€’ β€’

Missing some Tweet in this thread? You can try to force a refresh
γ€€

Keep Current with Juliette O'Brien

Juliette O'Brien Profile picture

Stay in touch and get notified when new unrolls are available from this author!

Read all threads

This Thread may be Removed Anytime!

PDF

Twitter may remove this content at anytime! Save it as PDF for later use!

Try unrolling a thread yourself!

how to unroll video
  1. Follow @ThreadReaderApp to mention us!

  2. From a Twitter thread mention us with a keyword "unroll"
@threadreaderapp unroll

Practice here first or read more on our help page!

More from @juliette_io

Jan 4, 2022
How many people are in NSW hospitals *with* Covid but not *for* Covid?

The Daily Telegraph says it's 40-50% of patients

I have data from 2 major hospitals that tell a different story

🧡 1/9

#covid19aus #covid19nsw #COVID19
I asked clinicians from 4 big hospitals for an analysis of a random sample of currently admitted Covid patients

2 could helpπŸ™

Both had very similar breakdowns:

~76-80% of Covid patients admitted *for* Covid illness
~20-24% admitted *with* Covid but for something else

2/9
Some more detail on the samples ...

Hospital A: n=21
Hospital B: n=101

Both samples were randomly selected and statistically significant given total Covid patients at each facility

3/9
Read 11 tweets
Dec 31, 2021
🚨 Those NSW hospitalisation numbers are >24 hrs behind and the situation is changing fast

ICU / ventilation increases this morning:

63 / 19 - NSW Health tweet 1
69 / 19 - NSW Health tweet 2
78 / 24 - Patient Flow Portal early AM
80 / 28 - PFP 10.20AM

#covid19aus #COVID19nsw
So from 8PM last night to mid-morning today ...

ICU patients have increased 16%
Ventilated patients have increased 47%

It is a huge jump

Both Omicron and Delta are circulating widely and feeding these numbers

*There are people with both variants in ICU*
We have little idea how much Covid there is in NSW, let alone the Delta v Omicron split

We do not know what hospitalisation / ICU / ventilation rates to expect

The best we can do is report on what is happening *right now*. Not what happened more than 24 hours ago
Read 6 tweets
Dec 29, 2021
NSW has deflected responsibility for the massive pressures on the pathology system by focusing public attention on QLD's tourism testing

But in fact sheer case load is also a major factor affecting the testing system's capacity

Quick🧡1/6

#covid19aus #covid19nsw #CovidTesting
Prof Dwyer has confirmed NSW pathology labs use the 'pooling' process outlined by the Reddit thread

Pooling is supposed to help the system process large numbers of samples

Eg. Test 4 samples as a group

Negative? Move on

Positive? Go back and test each sample individually

2/6
Prof Dwyer said today:

'The process of having to go back and retest positive pools takes a lot of time'

and

'The ability to pool is limited by how common the disease is in the community'

So the pooling process is directly affected by more cases / higher positivity rate

3/6
Read 7 tweets
Oct 12, 2021
🧭 NSW LGAs late-night monster wrap πŸ‘»

NSW as 3 diff outbreaks:

1. Southwest / West Syd: +162 = 4414 (-51%)
2. Rest of Greater Sydney: +50 = 1513 (-56%)
3. Regional NSW: +137 = 3064 (+36%)

Data: Cases today = 14-day sum (% 14-day change)

LGA details πŸ‘‡
#covid19nsw #covid19aus
Regional NSW -

πŸ“ Central Coast: +20 = 410 (10%) 😏

πŸ“ Illawarra Shoalhaven: +31=851 (-3%) πŸ˜ƒ

Kiama: +0 = 3 (-84%)
Shellharbour: +14 = 153 (-21%)
Shoalhaven: +3 = 121 (55%)
Wollongong: +14 = 574 (-2%)
πŸ“ Far West: +1=46 (-45%) πŸ€—

Broken Hill: +1=30 (-45%)
Wentworth: +0=16
Read 16 tweets
Oct 12, 2021
🧭 VIC LGAs late-night monster wrap πŸ‘»

VIC as 3 different outbreaks:

1. North/West Metro: +867 = 13,050 (+82%)
2. Rest of Metro: +479 = 6,670 (+352%)
3. Regional VIC: +110 = 1,190 (+441%)

Data: Cases today = 14-day sum (% 14-day change)

LGA detailsπŸ‘‡

#COVID19Vic #covid19aus
1. North/West Metro (original growth areas) -

πŸ“ North Melbourne: +511=7807 (50%) 😏

Banyule: +24=325 (102%)
Darebin: +53=686 (144%)
Hume: +203=3589 (17%) πŸ‘
Moreland: +63=1135 (46%)
Nillumbik: +6=85 (325%)
Whittlesea: +162=1987 (116%)
πŸ“ West Melbourne: +356=5243 (170%) πŸ˜’

Brimbank: +99=1345 (209%)
Hobsons Bay: +25=352 (72%)
Maribyrnong: +30=405 (426%)
Melton: +80=1277 (239%)
Moonee Valley: +35=522 (129%)
Wyndham: +87=1342 (115%)
Read 13 tweets
Oct 7, 2021
Waiting to hear back from @healthgovau media about Commonwealth hotspots expiring last night for 38 LGAs in VIC

Seems they're going to let the hotspots lapse in VIC, NSW, ACT

Here's a look at the very diff circumstances in each state

#covid19aus #covidvic #covid19nsw
1. VIC

Current hotspot declaration: 5 Aug - 7 Oct
Cases: 1,322 daily in Metro (7-day avg)
Vax: 55.6% 2 dose

*Shading = days covered by Commonwealth hotspots declaration
2. NSW

Current hotspot declaration: 26 Jun - 11 Oct
Cases: 584 daily in Greater Sydney (7-day avg)
Vax: 70.3% 2 doses
Read 7 tweets

Did Thread Reader help you today?

Support us! We are indie developers!


This site is made by just two indie developers on a laptop doing marketing, support and development! Read more about the story.

Become a Premium Member ($3/month or $30/year) and get exclusive features!

Become Premium

Don't want to be a Premium member but still want to support us?

Make a small donation by buying us coffee ($5) or help with server cost ($10)

Donate via Paypal

Or Donate anonymously using crypto!

Ethereum

0xfe58350B80634f60Fa6Dc149a72b4DFbc17D341E copy

Bitcoin

3ATGMxNzCUFzxpMCHL5sWSt4DVtS8UqXpi copy

Thank you for your support!

Follow Us!

:(