1/X AUGUST 23, 2021.
EUROPE OPEN BRIEF:.
Looking For Sign Of Weakness In Current Equity And Bond Yield Rally; Looking To Short Equity And Buy Bond Scalpers Ahead Of Jackson Hole Event
Article at Seeking Alpha:
seekingalpha.com/instablog/9103…
EUROPE OPEN BRIEF:.
Looking For Sign Of Weakness In Current Equity And Bond Yield Rally; Looking To Short Equity And Buy Bond Scalpers Ahead Of Jackson Hole Event
Article at Seeking Alpha:
seekingalpha.com/instablog/9103…
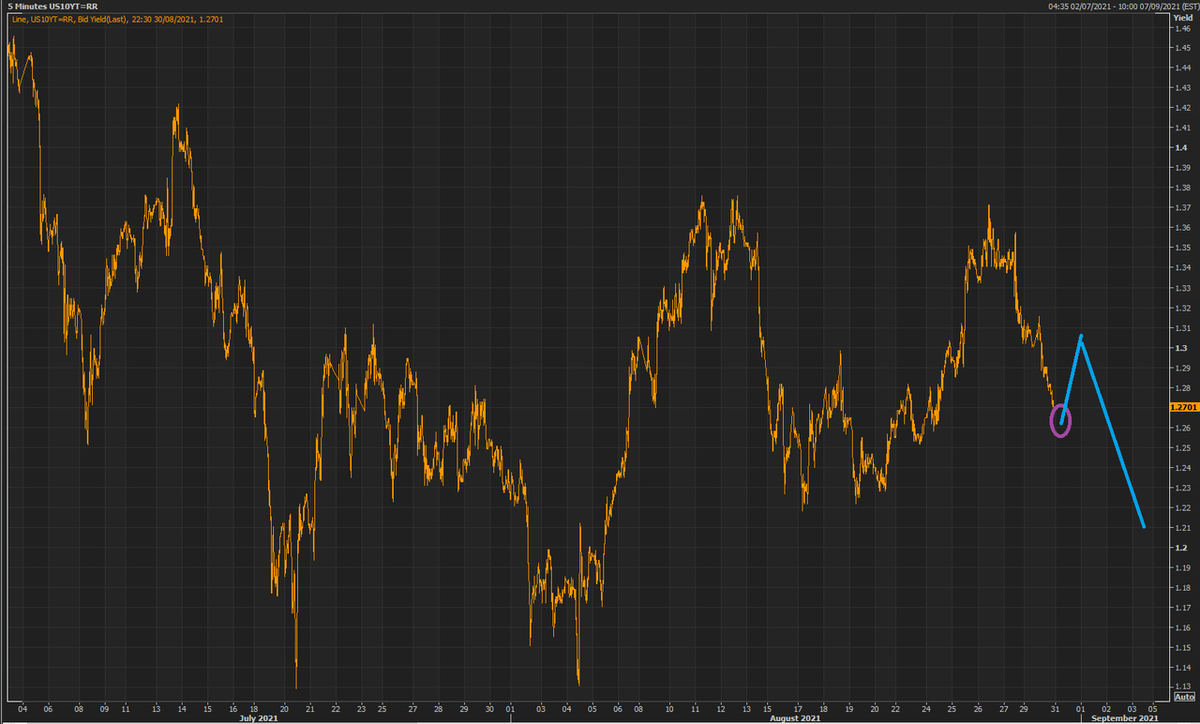
2/X This was our short-term schemata for the 10Yr Yield on Friday. 

3/X So far, the bond market reality is hewing to the Yield outlook.

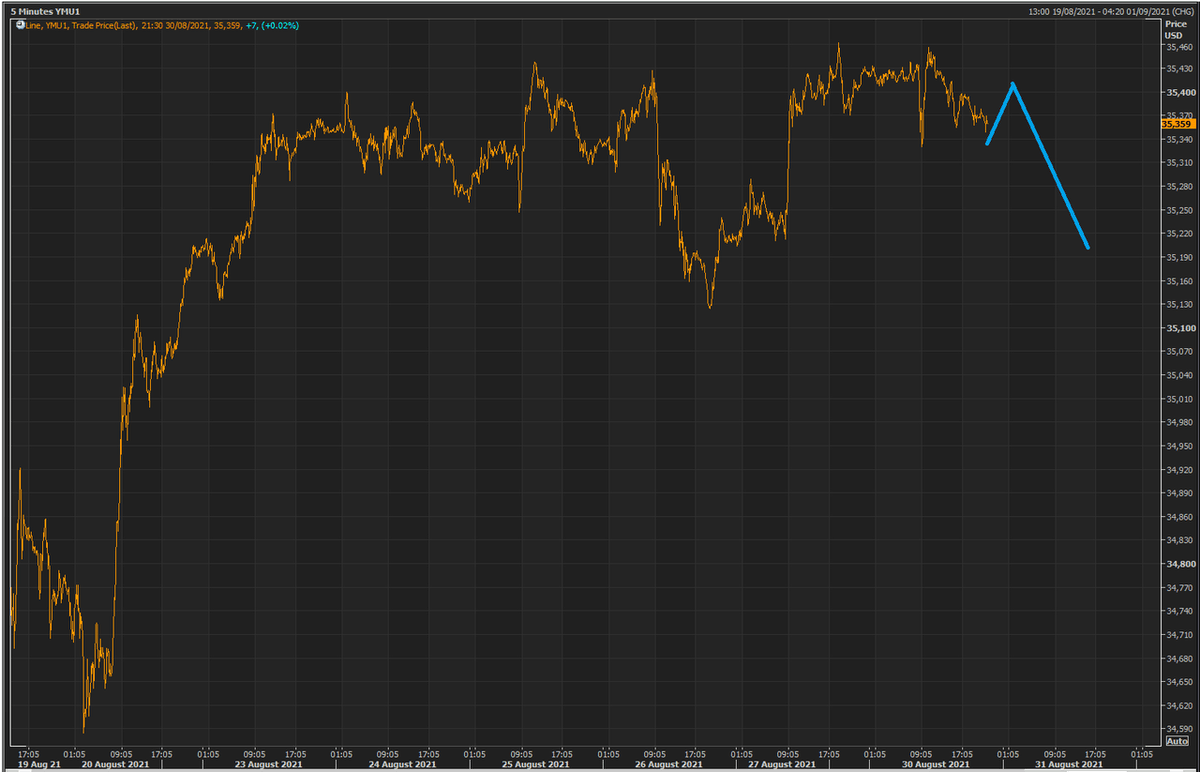
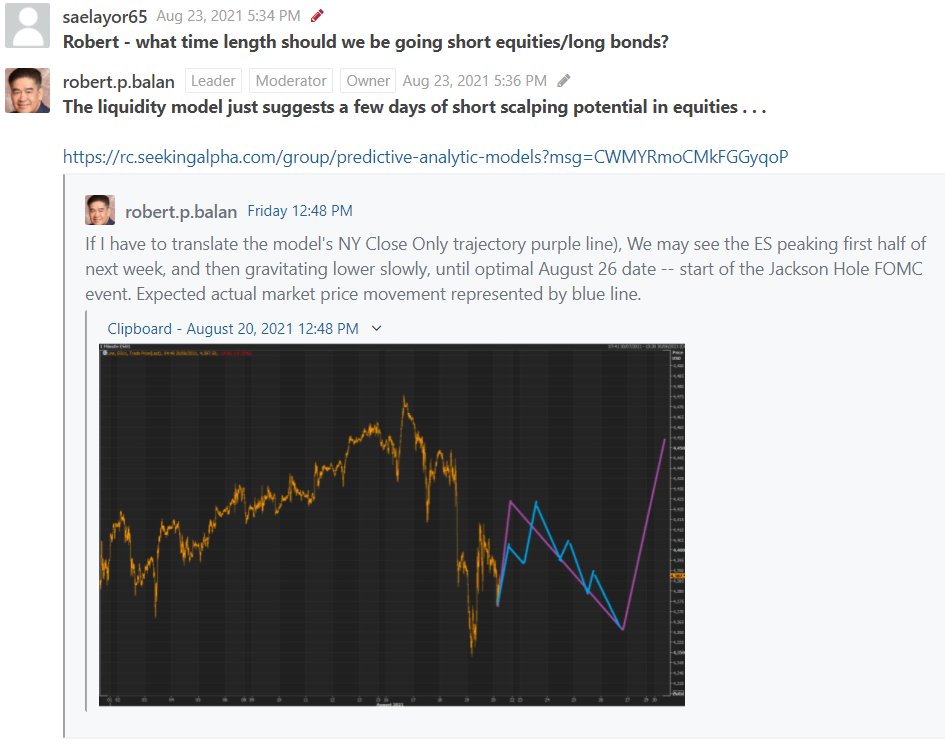
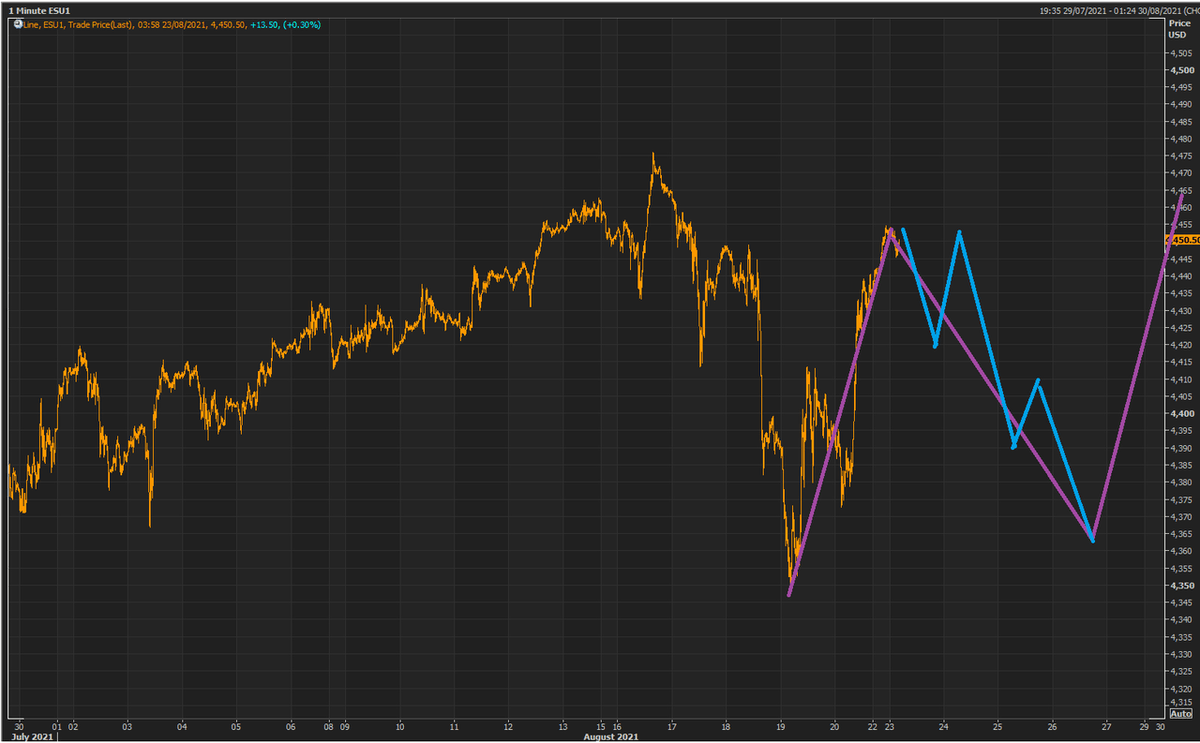
4/X This was our short-term schemata for the SPX on Friday.
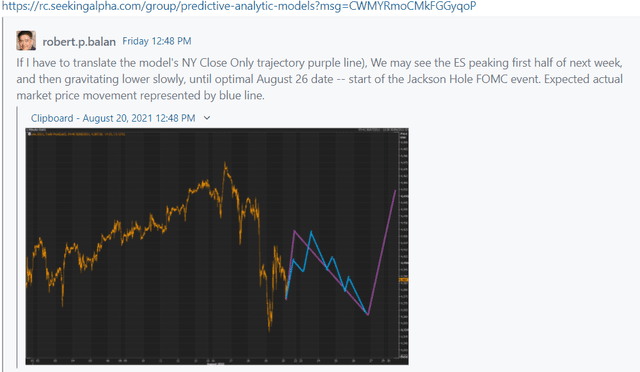
5/X This may be the variation which will hew to the SPX market reality.
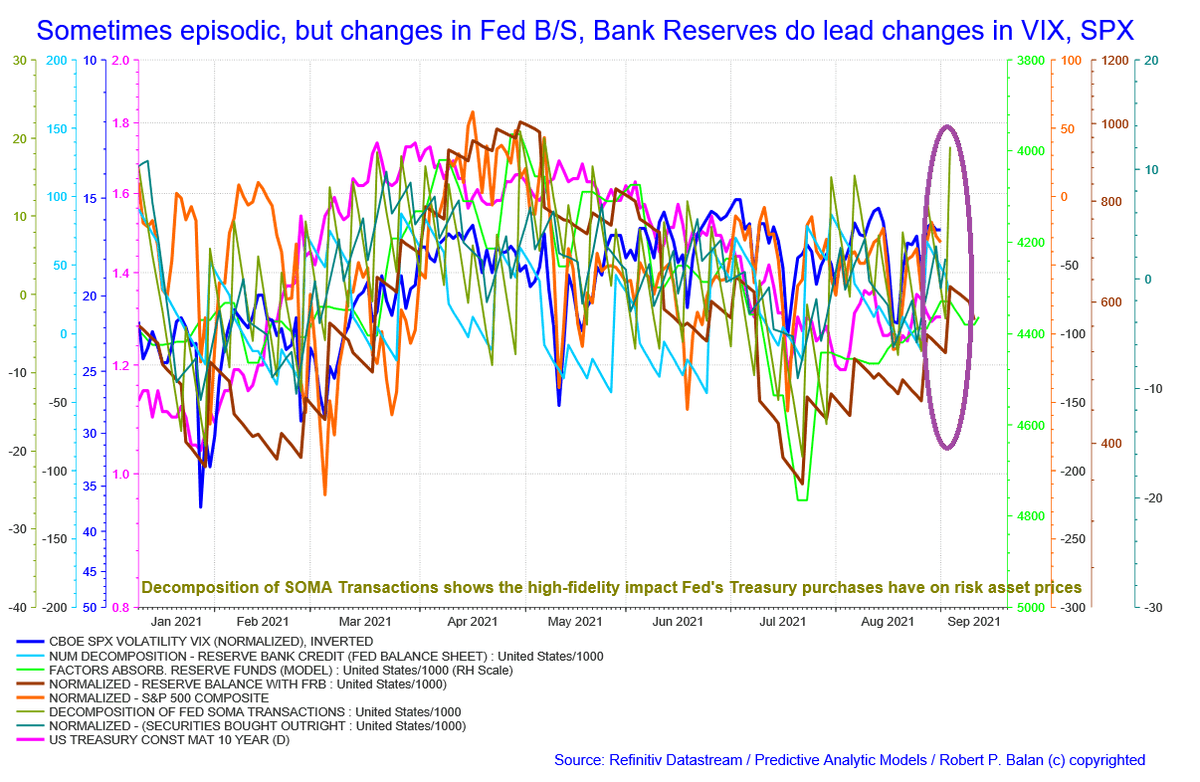
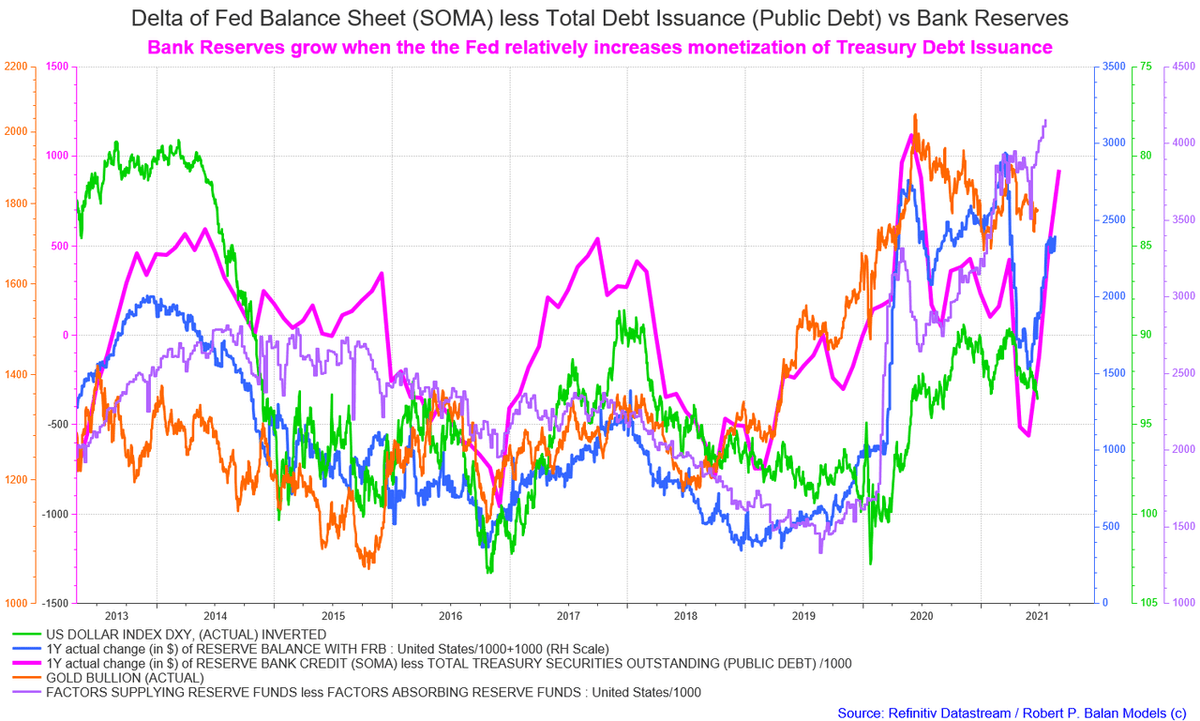
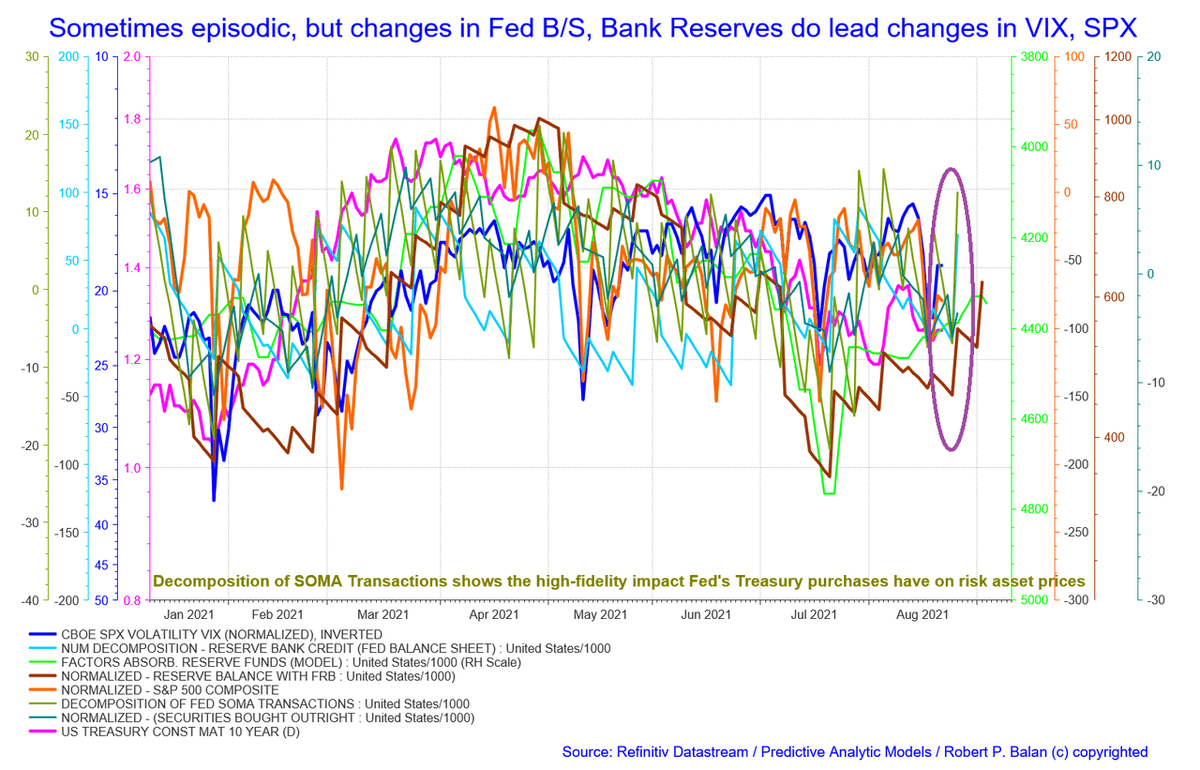
6/X Last week's update of the Fed's Balance Sheet shows a sharp build up of SOMA transactions to new higher highs. But the low inflection point sometime during the Fed's Jackson Hole convocation remains a stark reminder that the Yield and equities may still probing the . . .
7/X . . . the previous lows, before blasting off to a new seasonal upwards phase -- which may be powered by the lagged, positive impact of the Fed B/S growth last week.
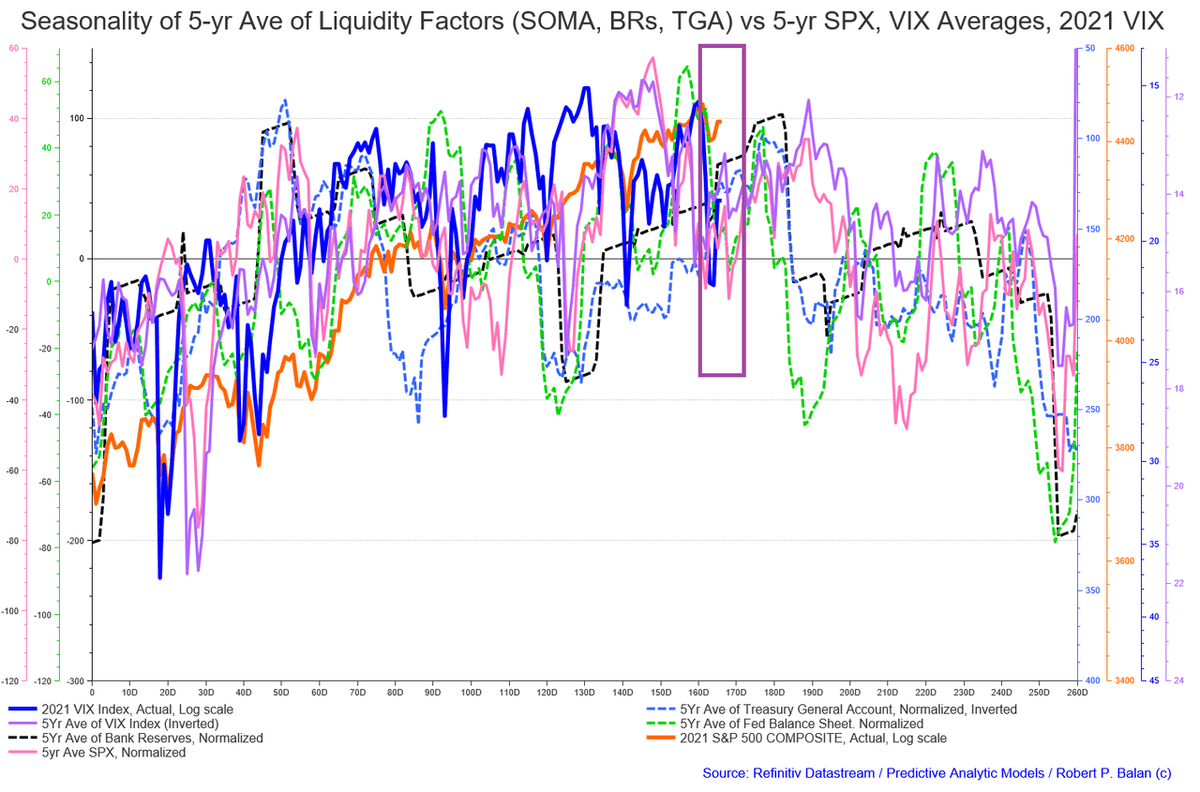
8/X Our seasonality chart shows the same decline in equities early in the week, then a recovery later in the week (purple rectangle). Amazingly, the historic seasonality trough also coincides with the Jackson Hole confab this year.
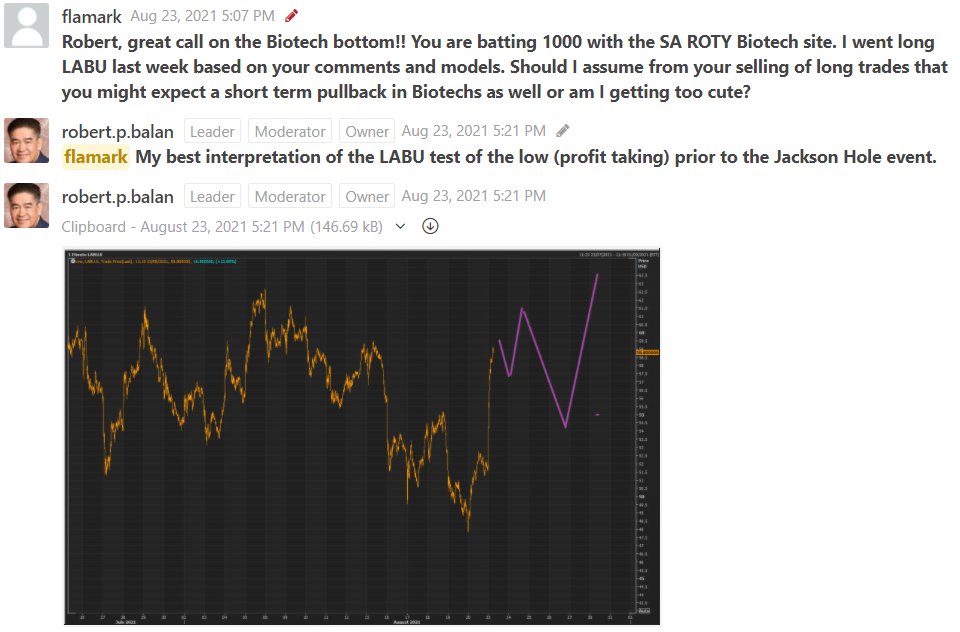
9/X Elsewhere in the equity sectors, Biotech looks to be in a final decline as will over the next few days, based on liquidity flow seasonality. This positive inflection point in Biotech may coincide with a new bull phase in Nasdaq as well.

10/10 SUMMARY: last Friday's report seems to be still describing current market action with some reasonable accuracy. However, the key remains what yields will continue to do. Our sense is that the 10Yr Yield will top out soon -- and so would equities.
seekingalpha.com/instablog/9103…
seekingalpha.com/instablog/9103…
• • •
Missing some Tweet in this thread? You can try to
force a refresh