1/X SEPTEMBER 1, 2021.
EUROPE OPEN BRIEF:
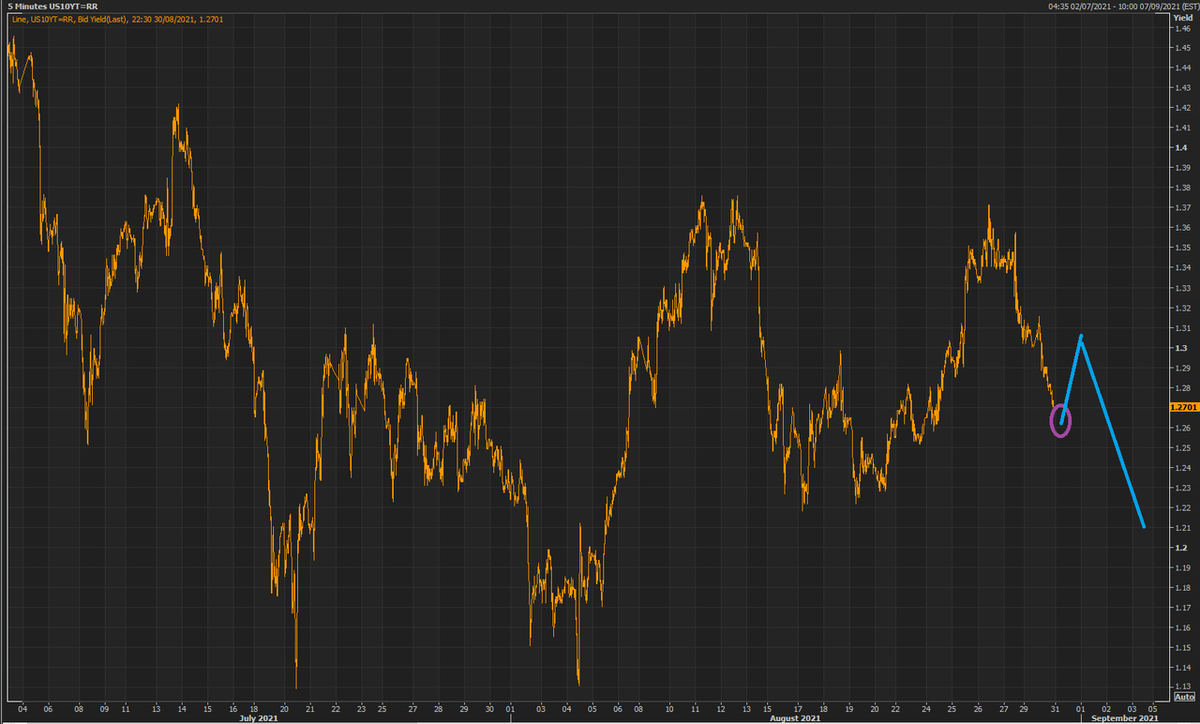
Day Of Reckoning: A Top Out In 10Yr; Yield-Equities Synch Now Taking Place, So Falling Yields Also Gets Falling Equities
Full presentation at Seeking Alpha:
seekingalpha.com/instablog/9103…
EUROPE OPEN BRIEF:
Day Of Reckoning: A Top Out In 10Yr; Yield-Equities Synch Now Taking Place, So Falling Yields Also Gets Falling Equities
Full presentation at Seeking Alpha:
seekingalpha.com/instablog/9103…
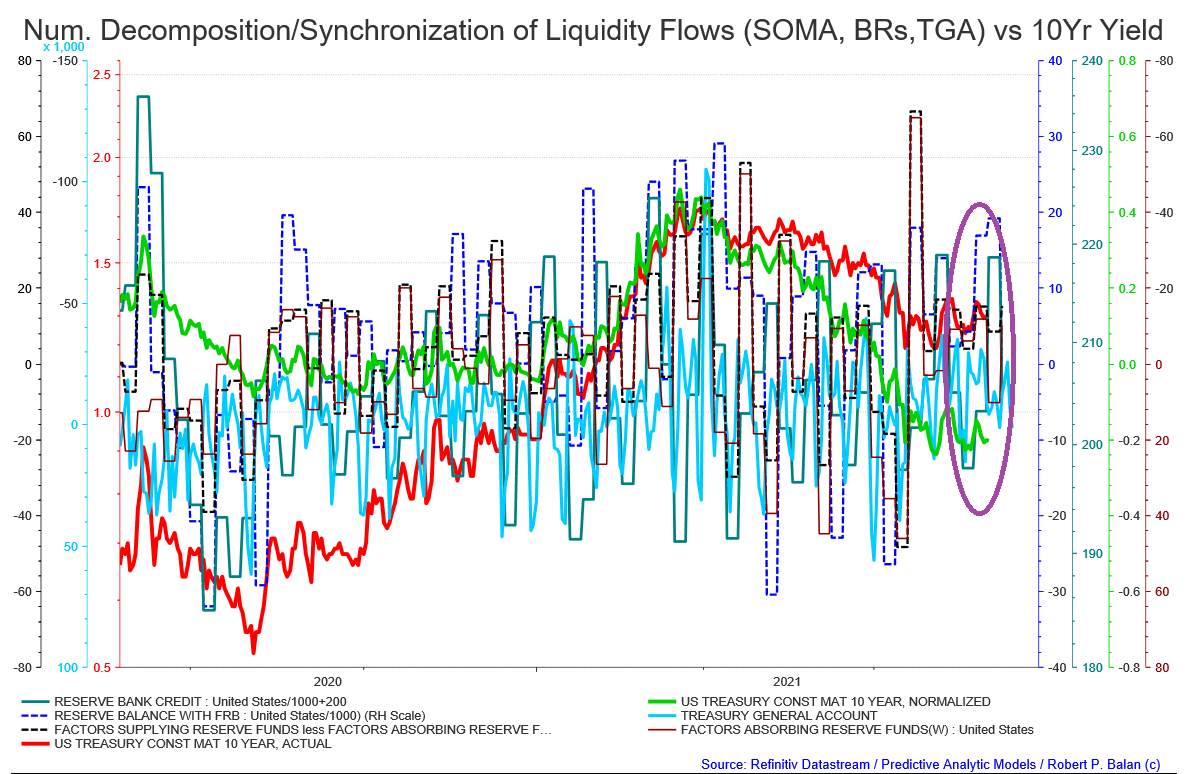
2/X Fed Balance sheet data components agree on a Sept 2/Sept 8 low data points (NY close basis). 
3/X The TGA-centric 10yr yield model also point to a Sept 2/Sept low data points (NY Close basis).
4/X A Sept 3 data trough also indicated in the SPX - VIX historic, 5Yr averaged seasonality.

5/X A different set of Fed B/S data component also agree on a Sept 2/Sept 8 low data points (NY close basis).
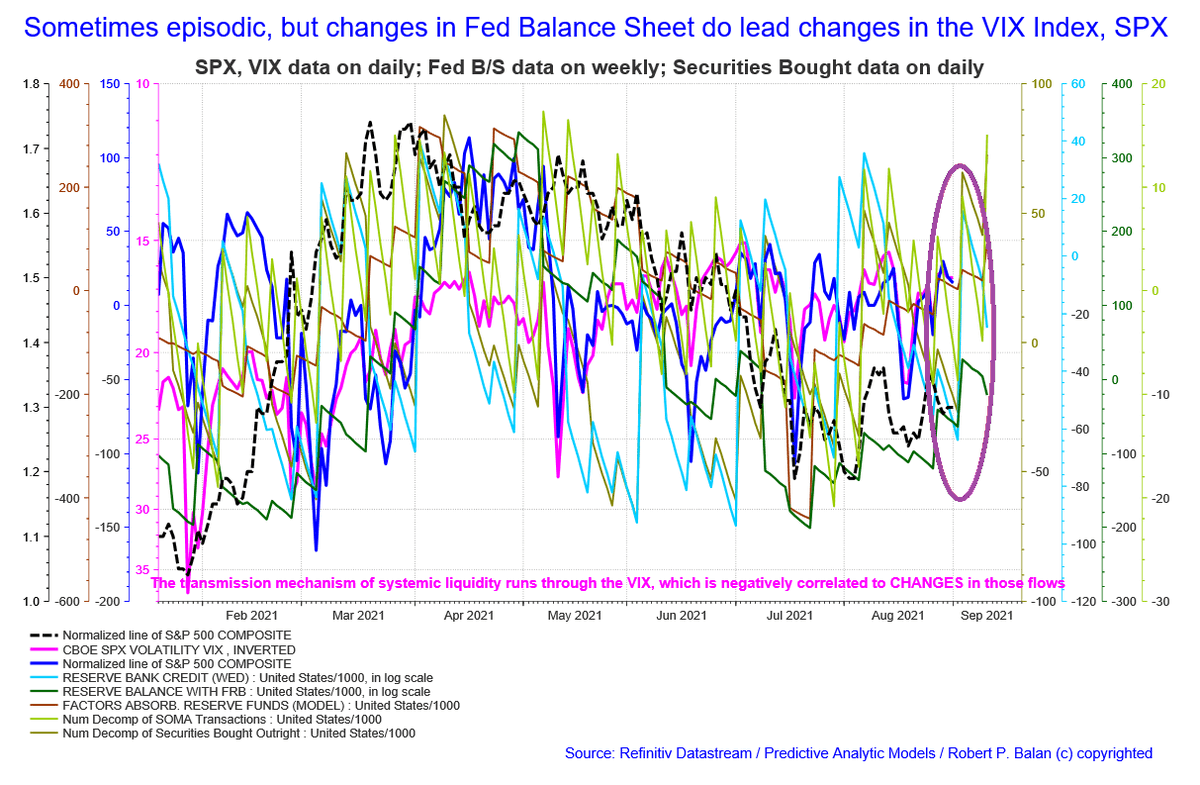
6/X This is one of the inherent issues one runs into when working with weekly and daily data points (NY weekly, daily close). Whereas we do the real-time analysis on intraday, tic by tic price change, we get the trading trend from models working with weekly and daily data . . .
7/X . . . points. So there's a lot of "filling-in-the-blanks" action and thinking during any trading day. But it is still useful to have the longer-term trend information, as it should dictate the bias in risk management.
8/X And of course, the entry and exit points are determined by what we deduce from very short-term price changes.For instance, the models are showing us a nested flows trough on September 2, a rally, then again a nested flows low point on September 8 (all NY close basis) . . .
9/X Here is a complete suite of systemic liquidity flows versus the historic (5yr average) seasonality of SPX, VIX and the 10Yr yield. The actual price data was adjusted to remove the MOTUs frontrun . . .
10/X . . . . We are assuming that the markets will perform per the average of the previous 5 years. But if the historic seasonality of systemic liquidity flows supersede, a top from here will extend the decline of risk assets for another four weeks.
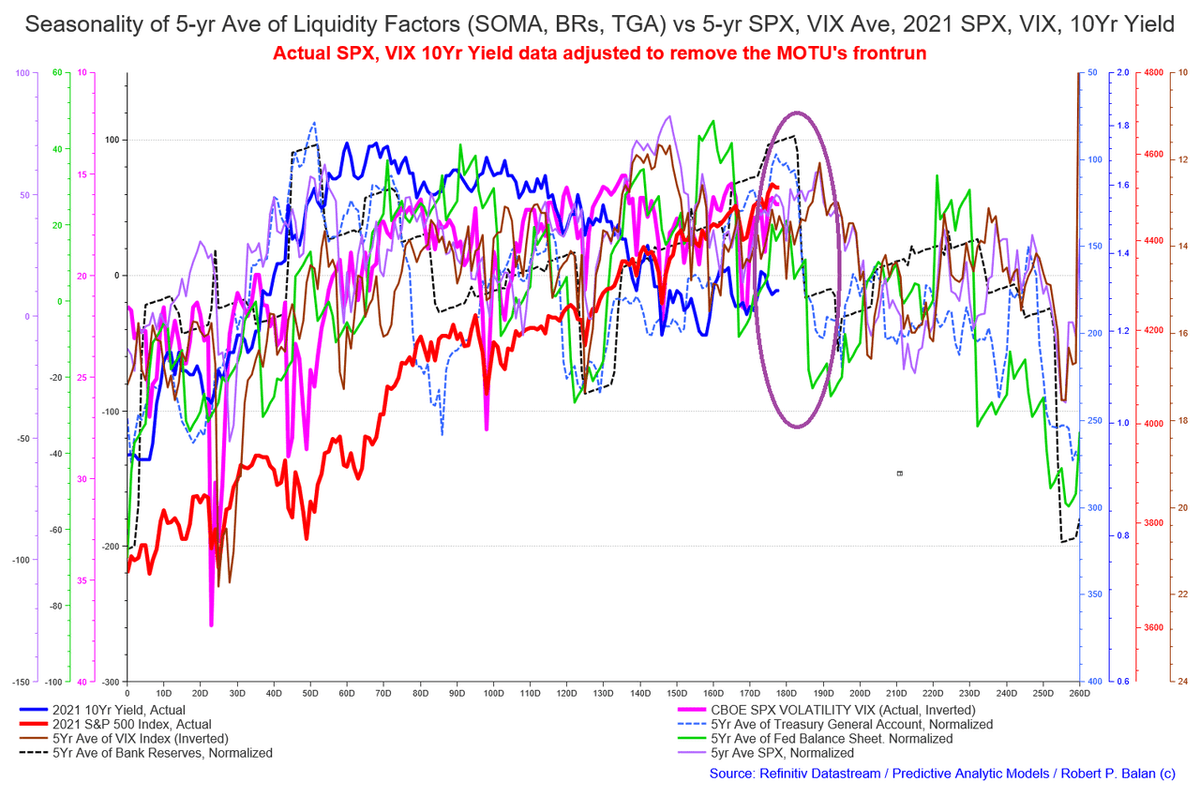
11/X . . Note the similarity in the modeled behavior of the central banks' purchase of long term US Treasuries to the historic seasonality of risk assets, shown in the chart immediately above . . .

12/X Note, too, that the Primary Dealers have turned cautious in their purchases (to own) long term securities, as the modeled behavior of the global central banks shows the impending end of those purchases.
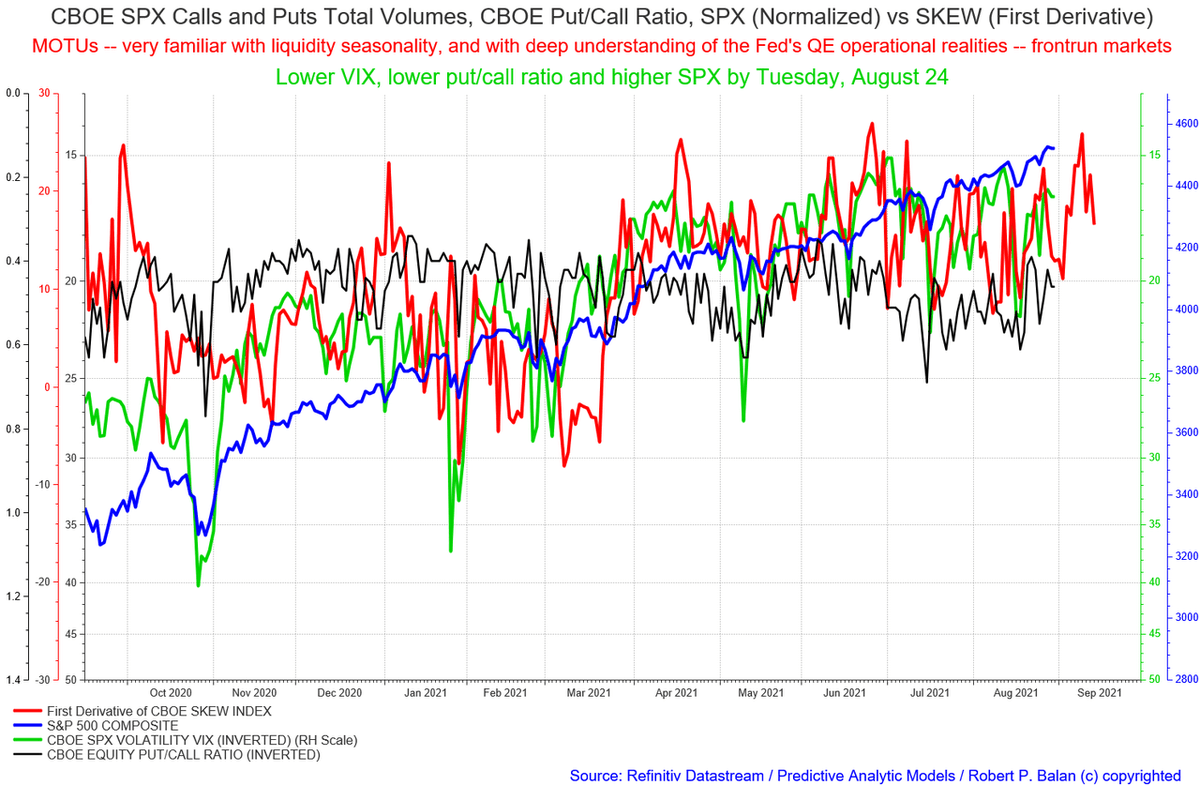
13/X And here is another non-liquidity market model, featuring the VIX, Put/Call Ratio and the "useless" SKEW Index. This is the most maligned chart at TWTR. But it has been useful to PAM since we started showing it to PAM four months ago. . . .
14/X . . . It is also calling for an SPX trough (VIX top) on September 2. It shows a rally for several days, then another sharp decline in SPX/rise in VIX -- pretty much the same trajectory the liquidity models as suggesting.
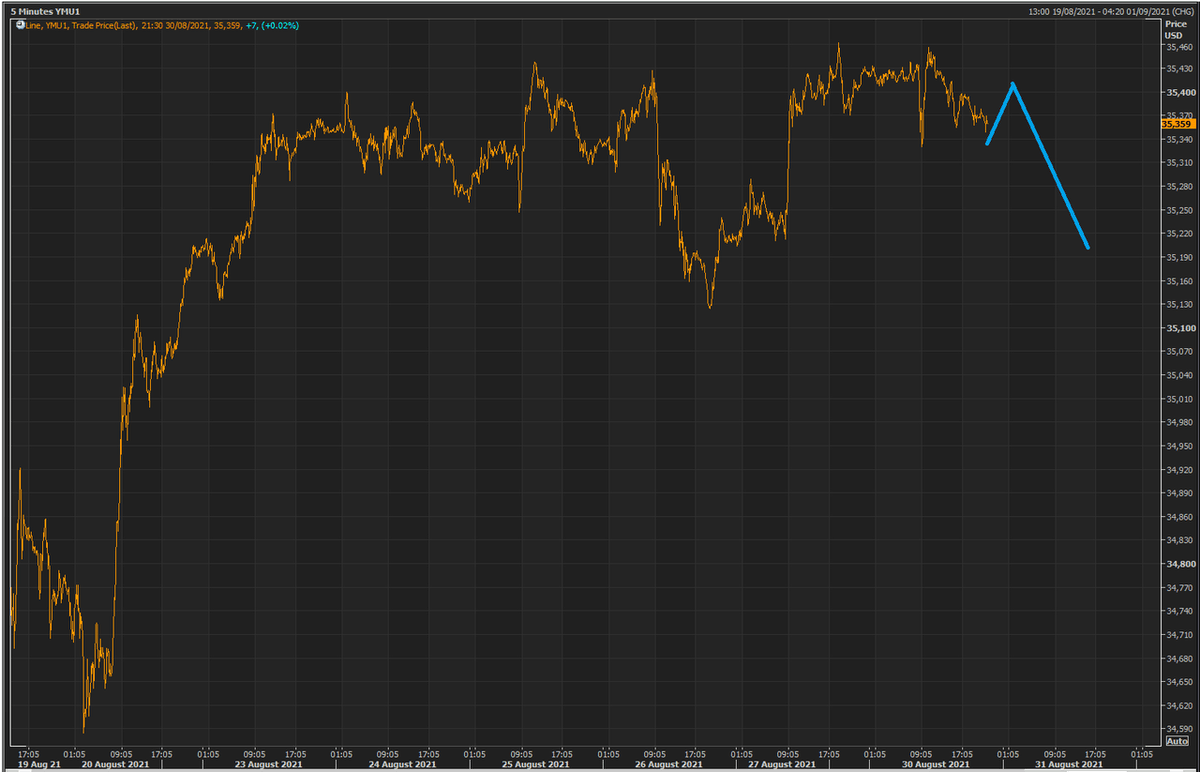
15/X I think we have seen the top of the upside retracement of the bond yields. Hopefully we see a two day decline in the Yield (NY closes) and revisit the 1.2300 area. That has more negative impact on RTY and YM, and should provide some cushion for NQ and ES.

16/X It looks like Gold had completed a very shallow correction from Aug 24 to 26.

17/X This is drawn to to synch with the expected moves of the 10Yr yield -- lower for a few more days (higher for Gold).

18/18 We will continue adding to this report as we go along the trading day.
19/19 flamark
Sep 1, 2021 4:06 PM
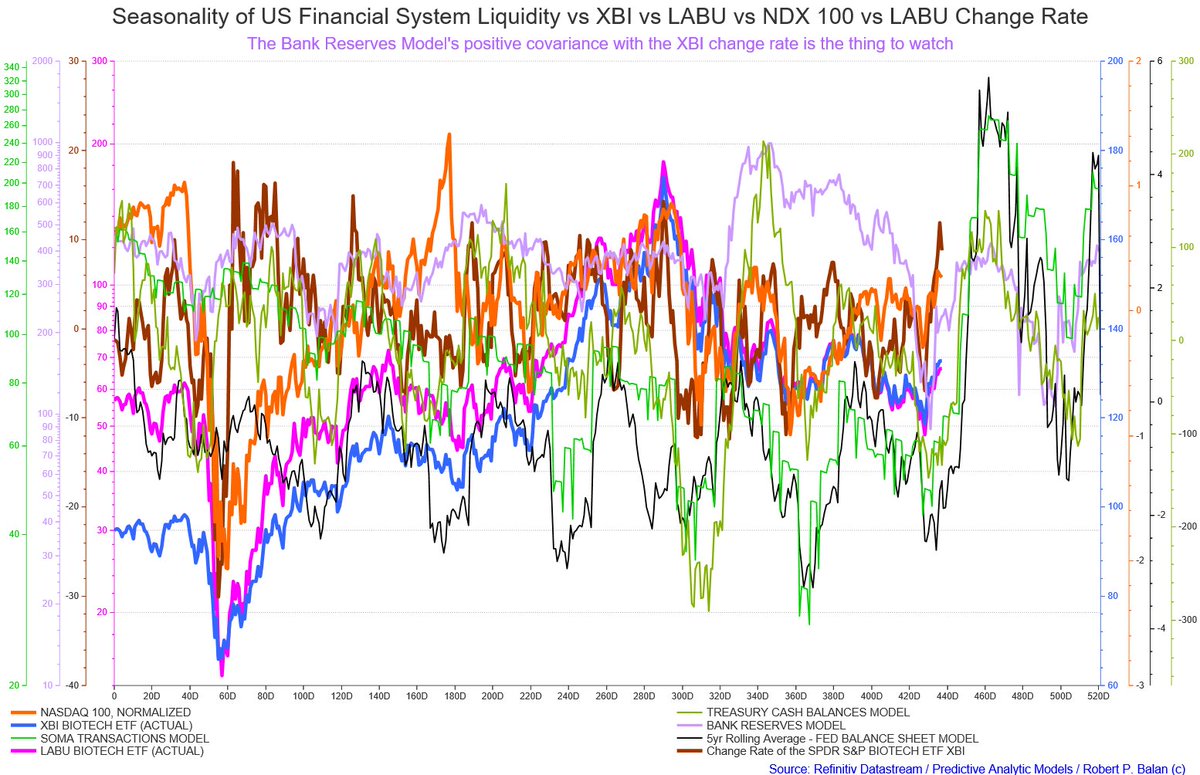
These models seem to show clear sailing for several weeks for XBI (and maybe NDX). Any thoughts on this. In the past you've pointed out that this is primary driver to follow follow for XBI/LABU and we have had big move right from the V bottom.
Sep 1, 2021 4:06 PM
These models seem to show clear sailing for several weeks for XBI (and maybe NDX). Any thoughts on this. In the past you've pointed out that this is primary driver to follow follow for XBI/LABU and we have had big move right from the V bottom.

20/20 Falling yields evidently superlative for NQ -- with yields expected to be depressed over at least two days, that should lead of NQ outperformance, by extension, Biotech as well. NQ can't completely dissociate with rest of the market, but it should fare better than the rest.
21/21 Here is the updated Biotech-NQ chart as it hews to historic seasonality of data points that are important to XBI and NDX.
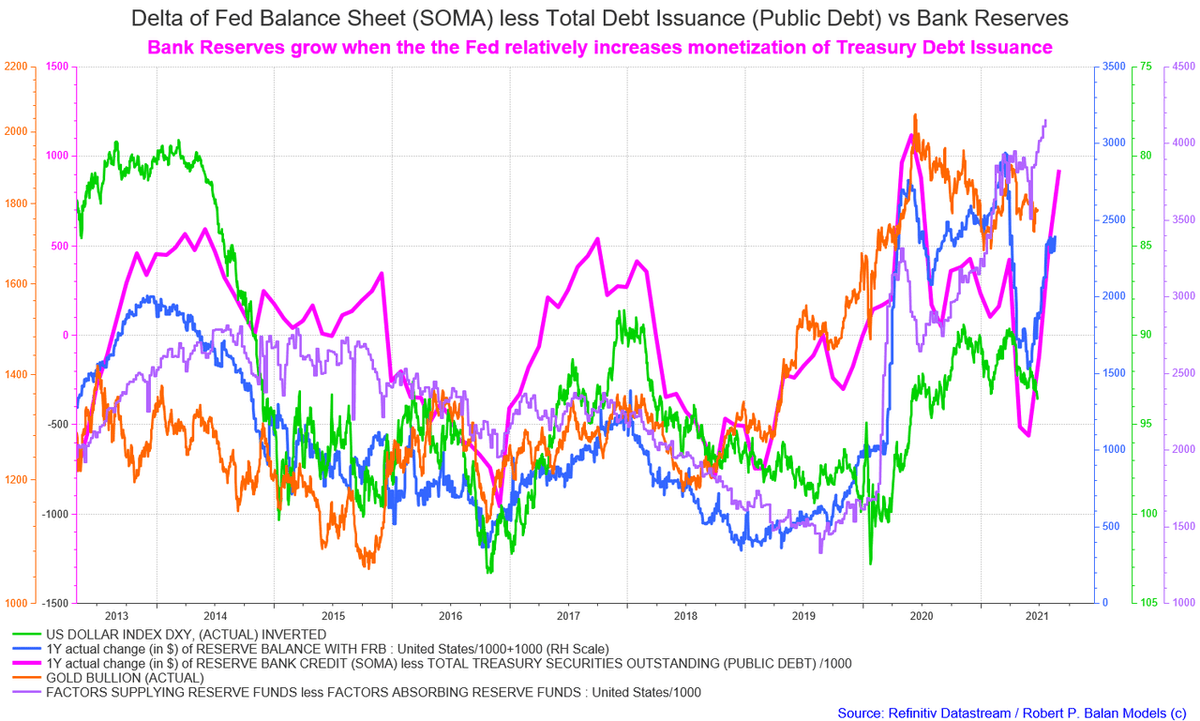
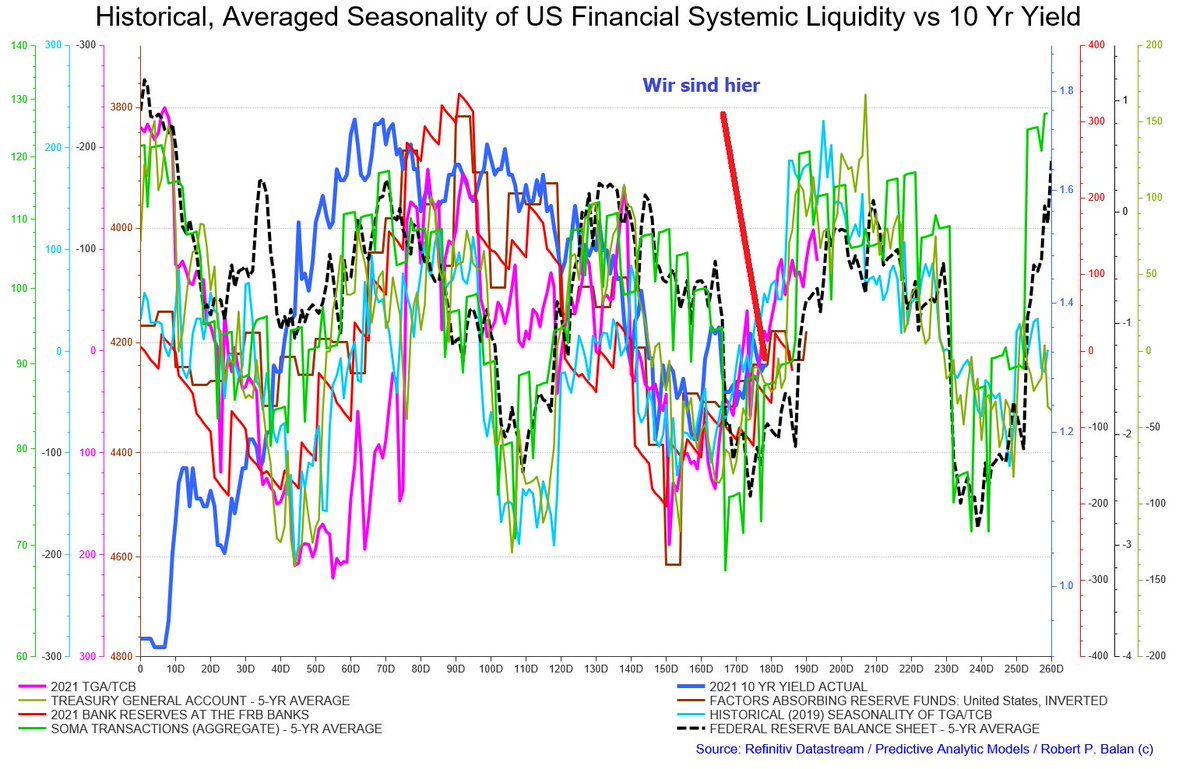
22/22 Here is one proof that 2021 liquidity data points are following the historic seasonality pattern. The pink and red lines (TGA and Bank Reserves, resp) are hewing close to the five year averages of the major Fed Balance Sheet components.
23/23 flamark
Sep 1, 2021 4:35 PM
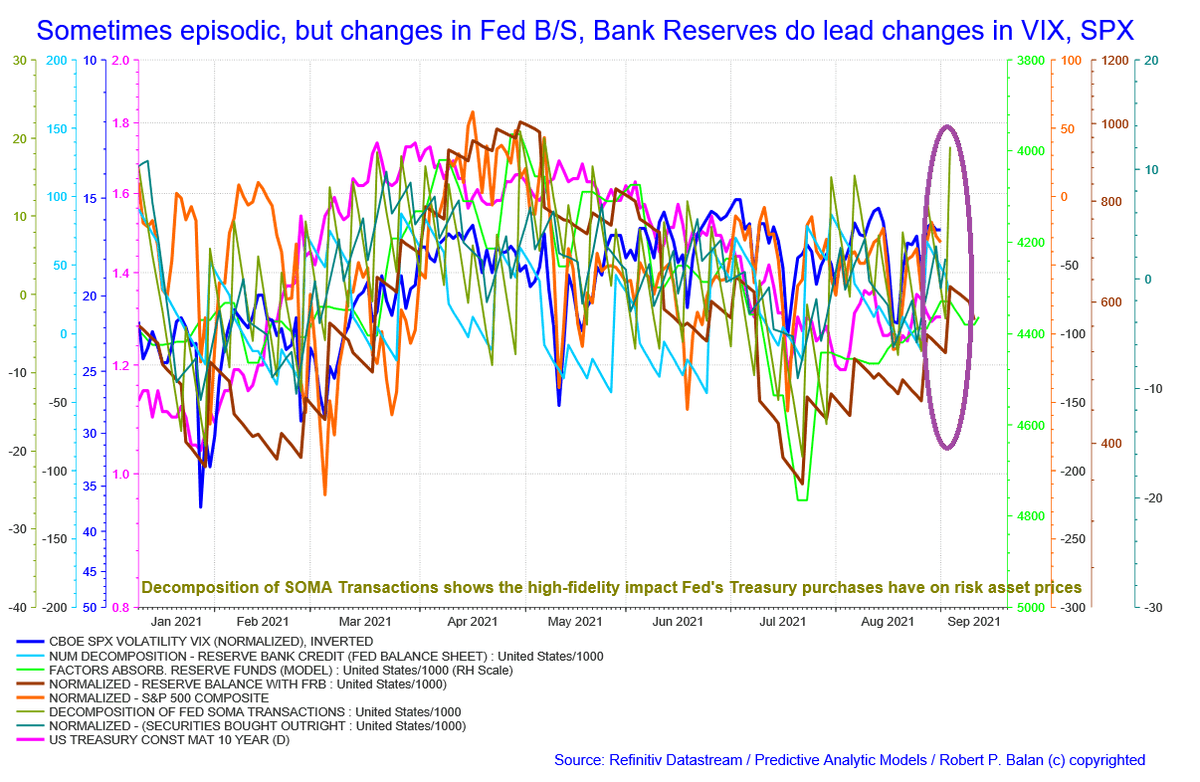
Robert, I'm curious while the trend in Bank Reserves (Pink) is up, there is a little consolidation/correction. Do you try to trade based on those moves? It seems to granular to me, but I am trying to learn your thought process.
Sep 1, 2021 4:35 PM
Robert, I'm curious while the trend in Bank Reserves (Pink) is up, there is a little consolidation/correction. Do you try to trade based on those moves? It seems to granular to me, but I am trying to learn your thought process.

24/24 flamark -- Its granular and can be precise, but sometimes its episodic if you take the data point twists and turn literally. These models are interpolated (daily) subsets of monthly and weekly data points, so there is always a large room for error in the translation.
• • •
Missing some Tweet in this thread? You can try to
force a refresh