1/X Rising Bank Reserve Creation, And Upswing In Systemic Liquidity Inflows Should Launch A Seasonal Upcycle For Equities, Yields, And Gold; Downswing For The US Dollar (DXY)
Full presentation at Seeking Alpha:
seekingalpha.com/instablog/9103…
Full presentation at Seeking Alpha:
seekingalpha.com/instablog/9103…
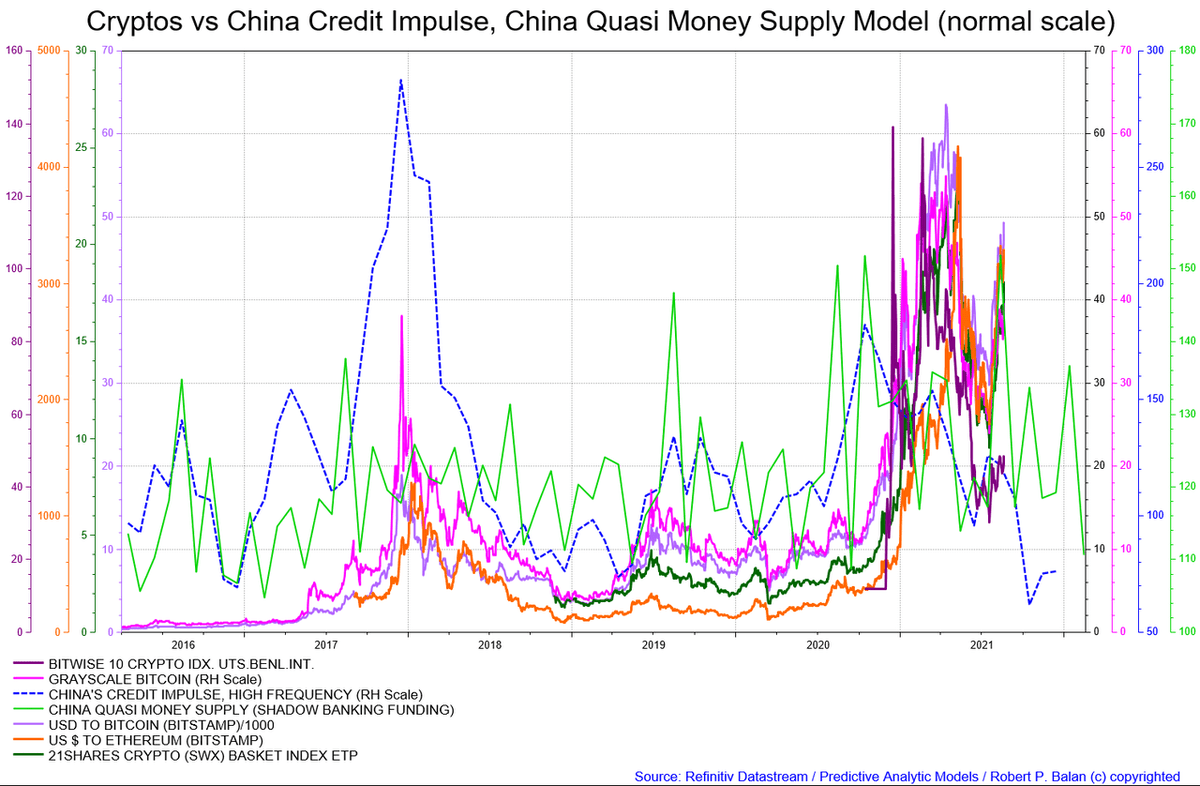
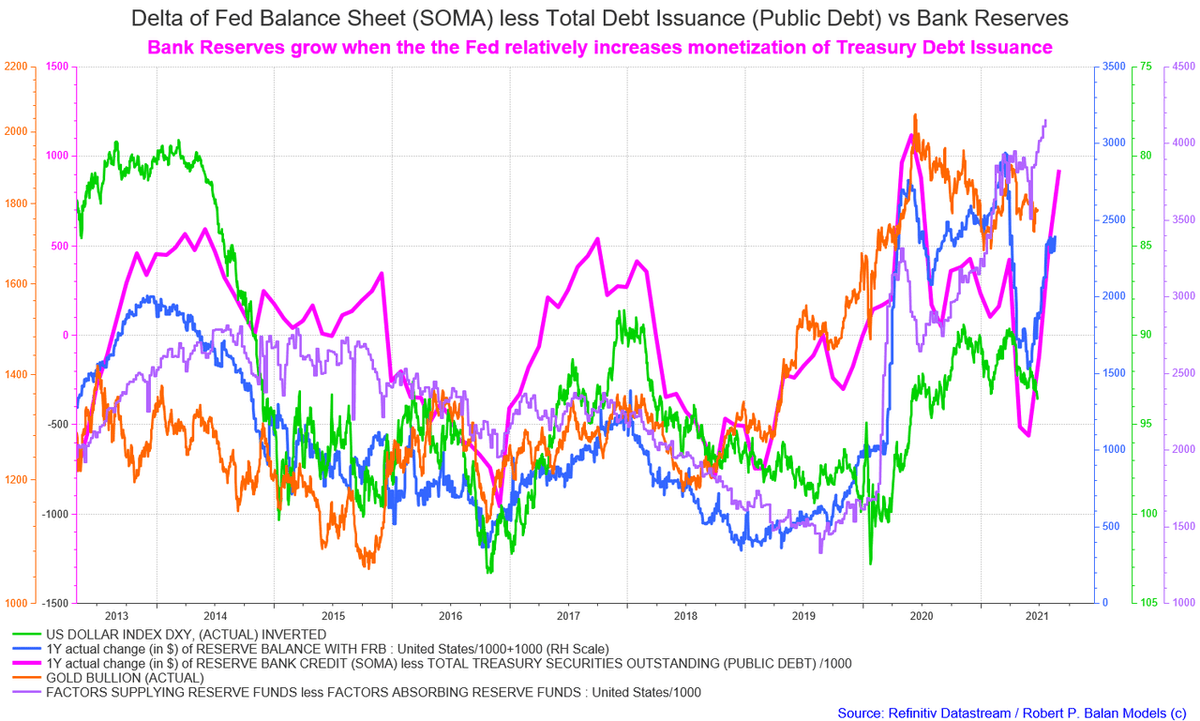
2/X This is the Big Picture for DXY and Gold (from liquidity point of view) that works for me. Sharply rising liquidity in the form of Bank Reserves boosts equities and Gold, and kills the US Dollar (DXY) via the QTM. Gold (yellow line in the chart below) is at the verge . . .
3/X . . . of a sharp take-off after the Fed's Jackson Hole confab, rising in the wake of a new equity seasonal bull phase. 
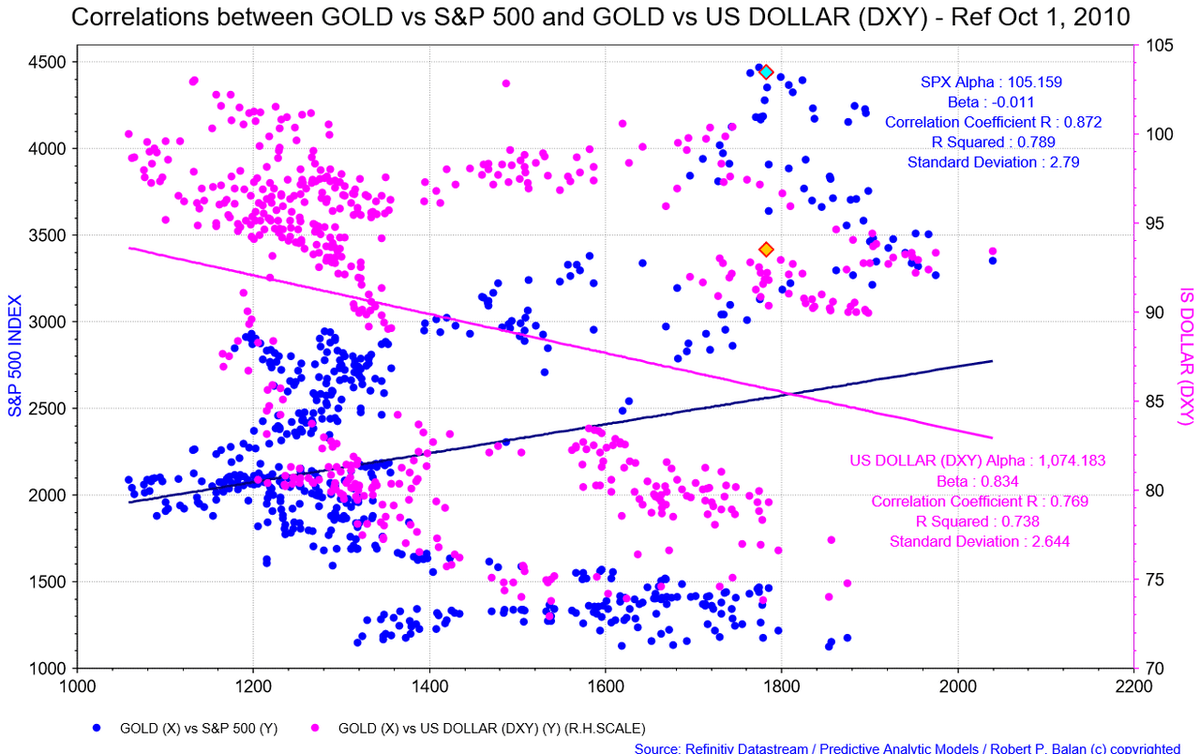
4/X Gold has better R^2 (coefficient correlation) with Equities relative to US Dollar (DXY). Our experience has been that Gold prospers during times of equity bull phases. If the US Dollar (DXY as proxy) happens to be weak at that time, then its double whammy positive for gold.
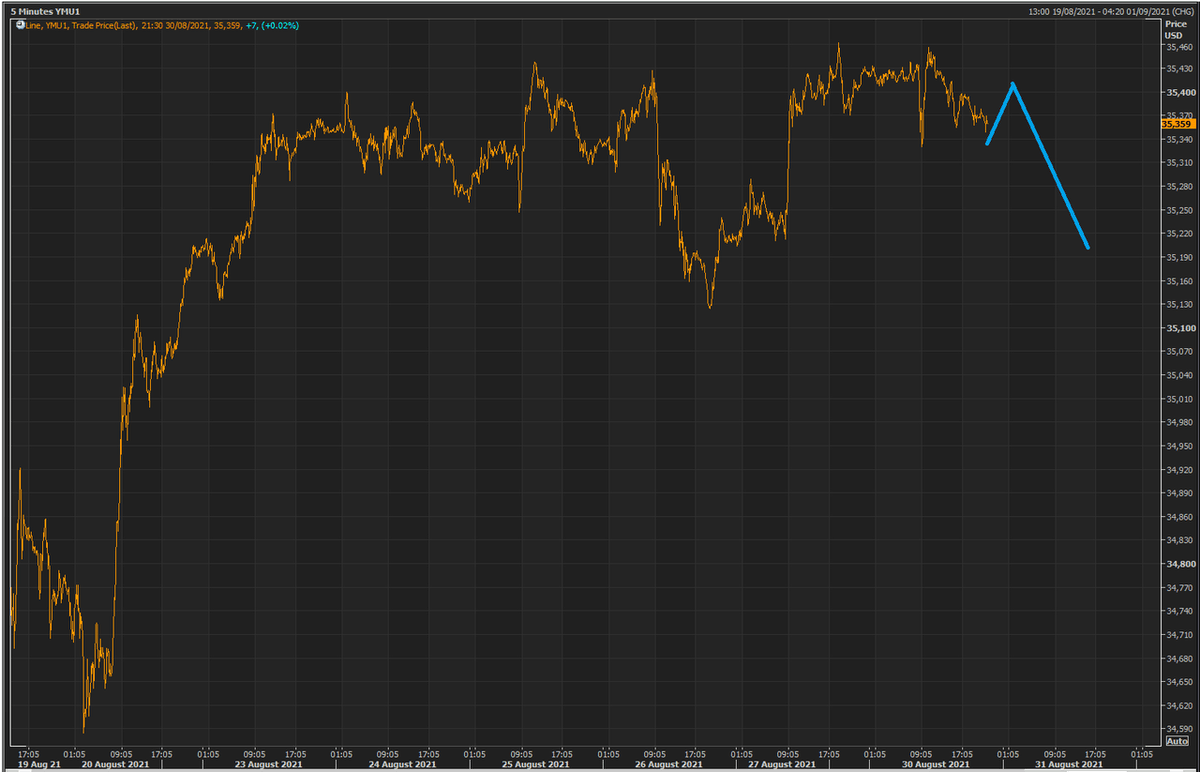
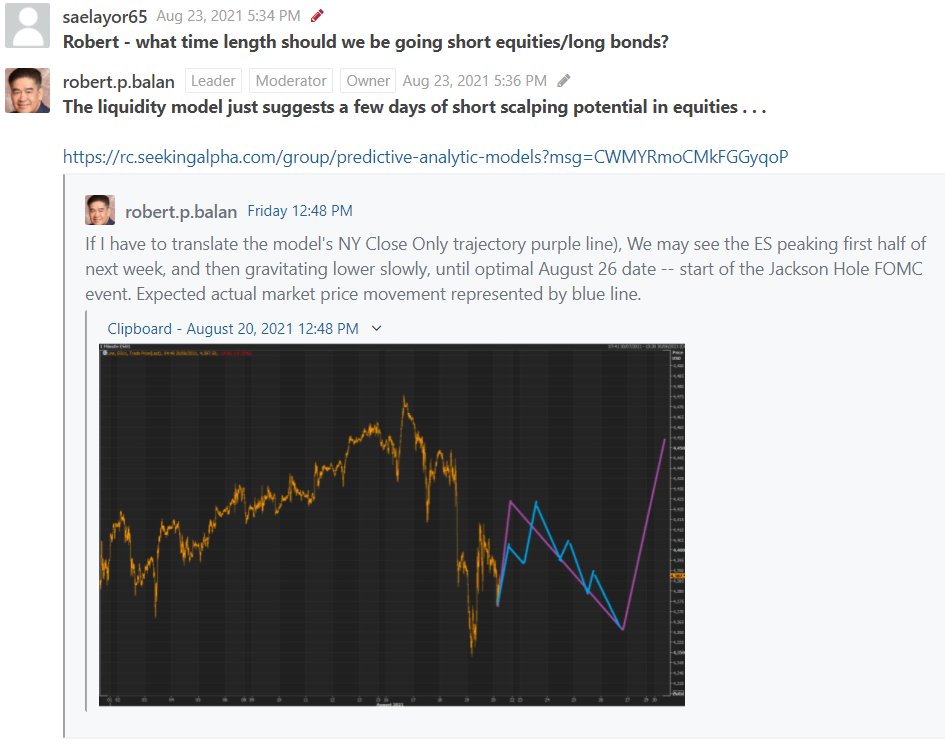
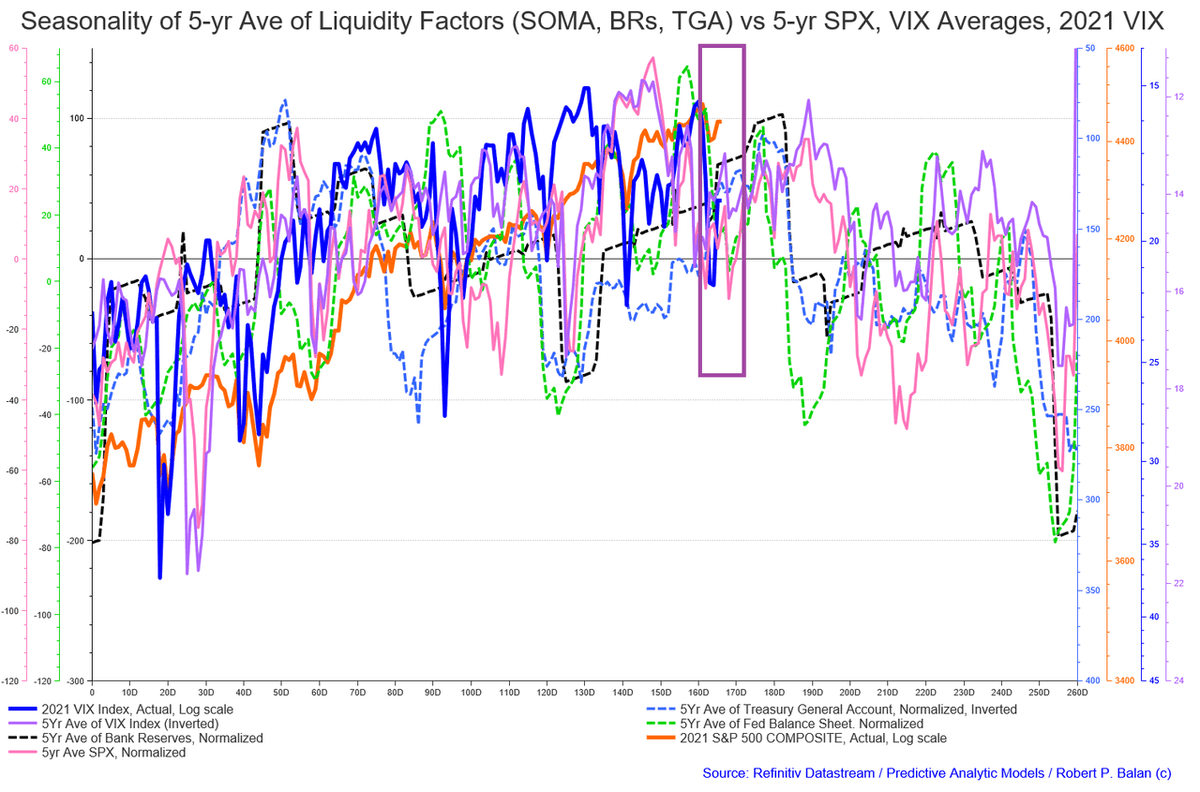
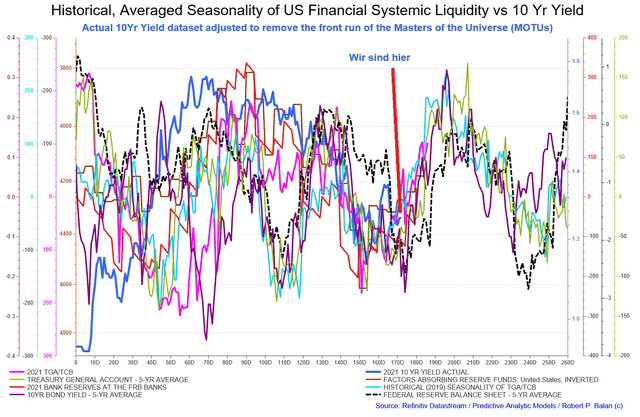
5/X The timing is also just right. Our seasonality chart shows a final decline in equities early this week, then a recovery late in the week (purple rectangle). Amazingly, the historic seasonality trough also coincides with the end of the Jackson Hole confab this year. . .
6/X Lesser Treasury debt issuance and Fed keeping its QE scheduled commitments, suggests that the delta between Fed Balance Sheet and Treasury Debt Issuance growth will widen -- essentially, Bank Reserves will rapidly grow. . .
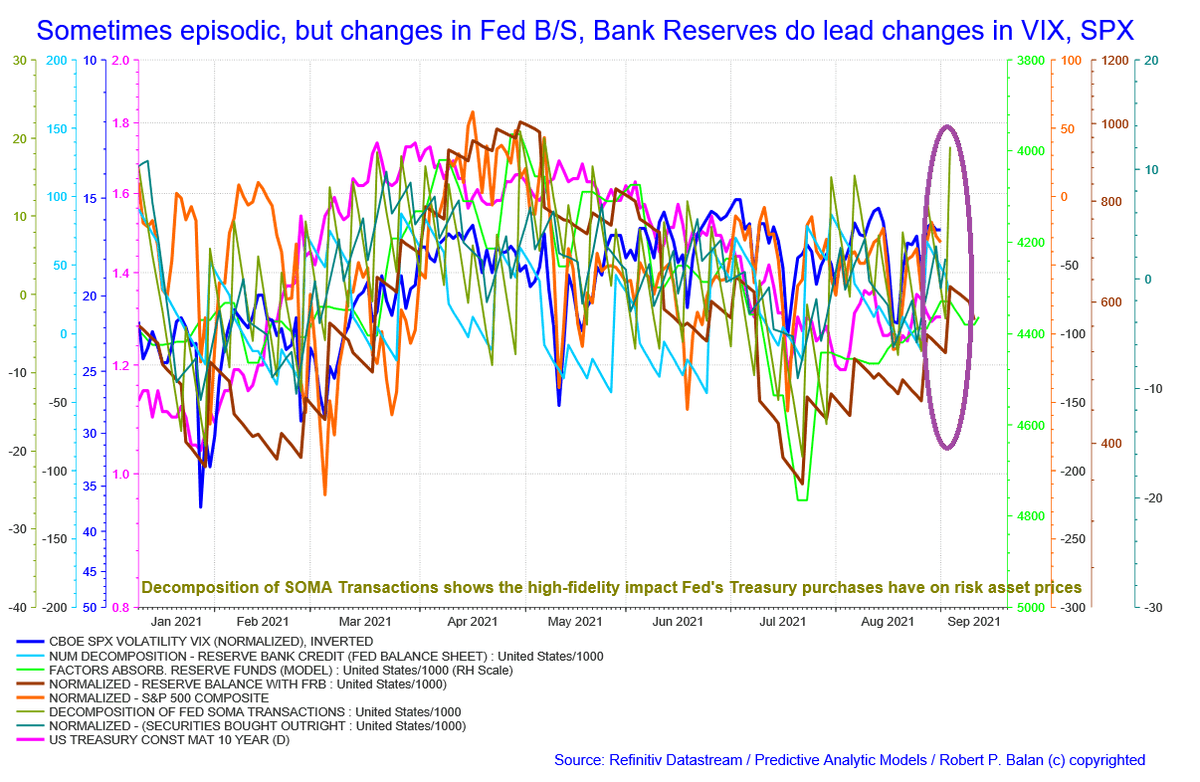
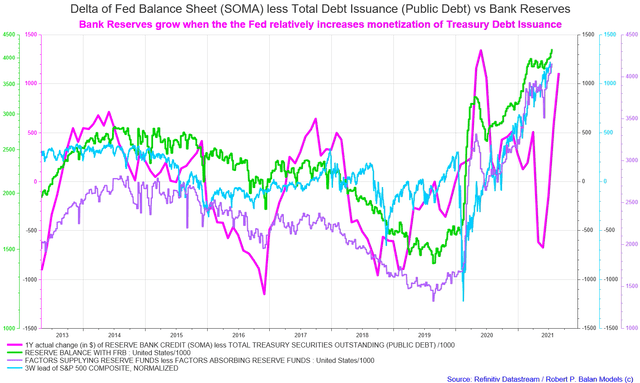
7/X We already see that in the difference between Factors That Supply Bank Reserves and Factors That Absorb Bank Reserves (purple line). This is how it looks, with other factors deleted from the picture:
8/X It is also a very benevolent situation for the S&P 500 Composite Index. The lagged impact of the Bank Reserve changes suggests that the SPX should be significantly higher four to five weeks (at least) from now, even with market jitters ahead of the Jackson Hole conference.. .
9/X We are not making an overreach. We're simply saying that as from the end of this week, we look for higher equities, rising Gold prices, falling US Dollar, and probably rising yields -- during the duration of the new seasonal liquidity inflow over the next four to five weeks.
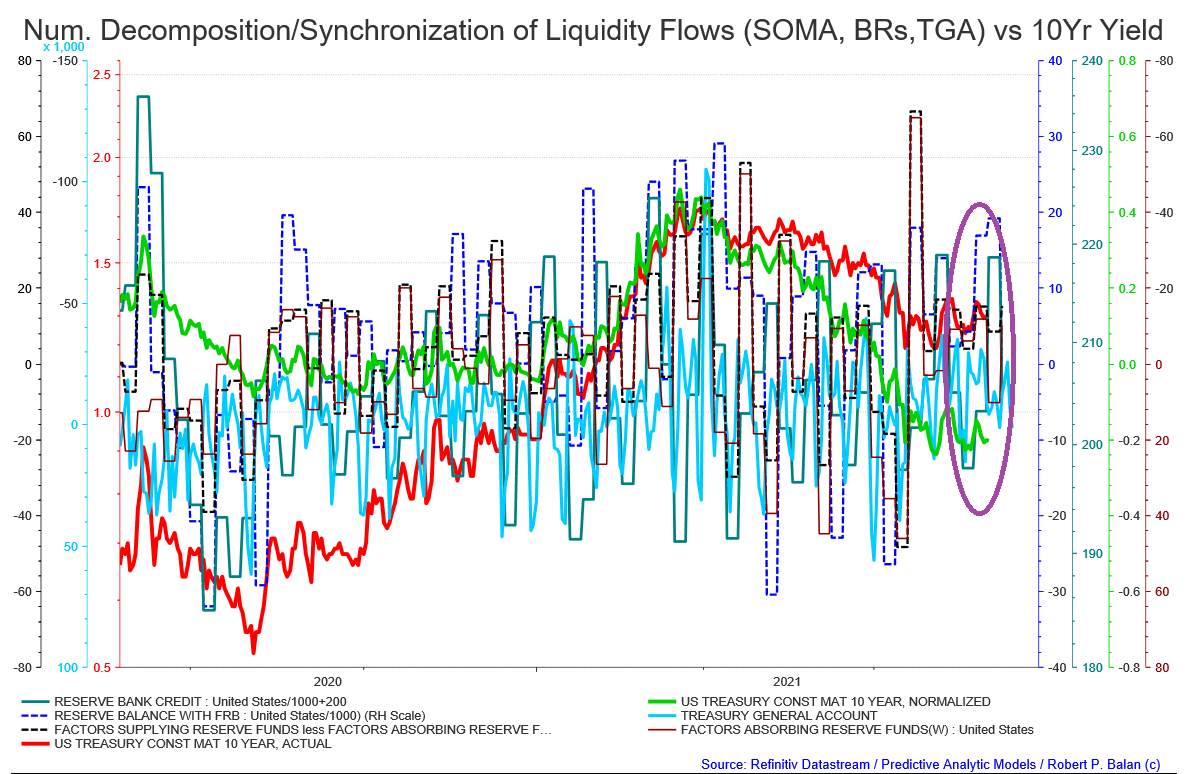
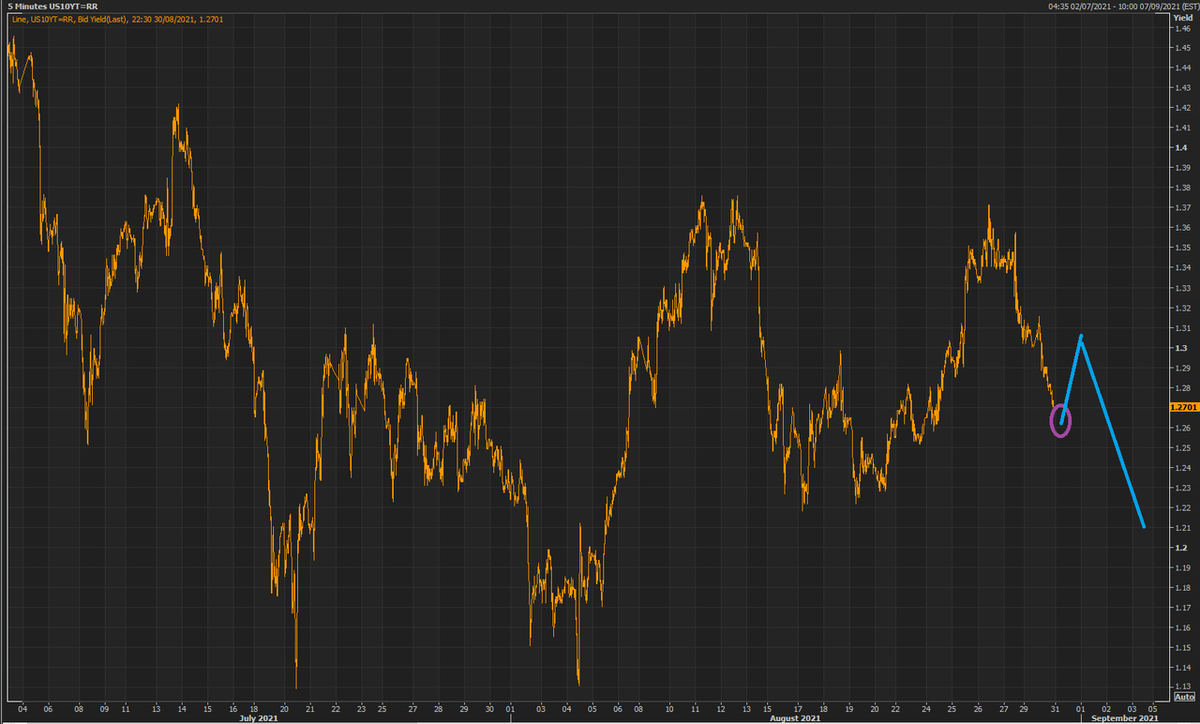
10/X Yields have generally risen at this time of the year, after making a trough at the usual low points of the seasonal liquidity flows which is due within the next three trading days (brown line in the chart below).
11/X Q3, Q4 2021 US GDP growth looking dismal. US CESI been falling for five months. We just can't see the Fed tightening under these growth conditions. Falling growth is NOT normally conducive to rise in risk assets. But falling growth now means more intervention from the Fed.

12/X As the US Treasury reduces debt issuance, market-linked measures of inflationary expectations moderated as well. The lead of the Inflation Swaps 5yr/5yr Compensation Rate (the Fed favored inflation gauge) has already rolled over, as does the 10Yr Bond Term Premium. . .
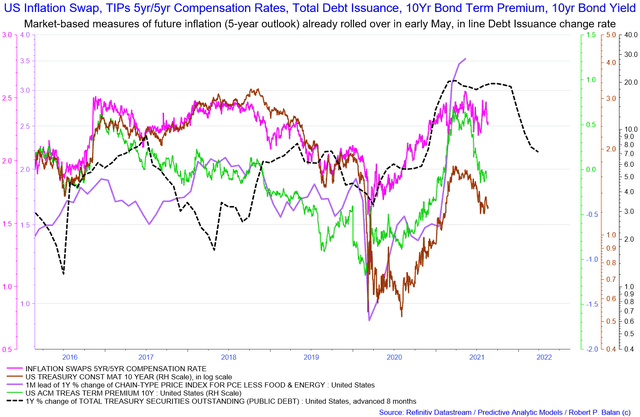
13/X Core PCE (less Food and Energy) lags these two series by a month. The July PCE should fall, following the trajectory of the inflation swap rates. Falling inflation rates removes the last viable argument for Fed raising rates or tapering the monthly QE schedule.
14/X SUMMARY:
The historic seasonality of liquidity flows will make a low point late this week. 2021 liquidity sources also look to make their trough during same period. With Bank Reserve creation on the upswing, that can only be favorable for Equities, Gold, bad for US Dollar.
The historic seasonality of liquidity flows will make a low point late this week. 2021 liquidity sources also look to make their trough during same period. With Bank Reserve creation on the upswing, that can only be favorable for Equities, Gold, bad for US Dollar.
15/15 Historically, bond yields also rose from the period starting late this week, to a high point four to five weeks later. Some seeming inconsistencies in the asset price outlooks, but that was how these asset fared during this incoming seasonality flows in the past.
• • •
Missing some Tweet in this thread? You can try to
force a refresh