❗ 23-AUG-2021 UPDATE ❗
1/15
Latest data updates on #COVID19 vaccinations, cases, hospitalizations, deaths, and disparities are posted on our dashboards.
#epitwitter #PedsICU @Cleavon_MD @DrEricDing @RheaBoydMD
covkidproject.org
1/15
Latest data updates on #COVID19 vaccinations, cases, hospitalizations, deaths, and disparities are posted on our dashboards.
#epitwitter #PedsICU @Cleavon_MD @DrEricDing @RheaBoydMD
covkidproject.org
❗ 23-AUG-2021 UPDATE ❗
2/15
Average daily incidence of #COVID19 in children/teens ⬆️ to 40.4/100,000 this week. Cumulative cases = 5.6 million.
covkidproject.org
2/15
Average daily incidence of #COVID19 in children/teens ⬆️ to 40.4/100,000 this week. Cumulative cases = 5.6 million.
covkidproject.org

❗ 23-AUG-2021 UPDATE ❗
3/15
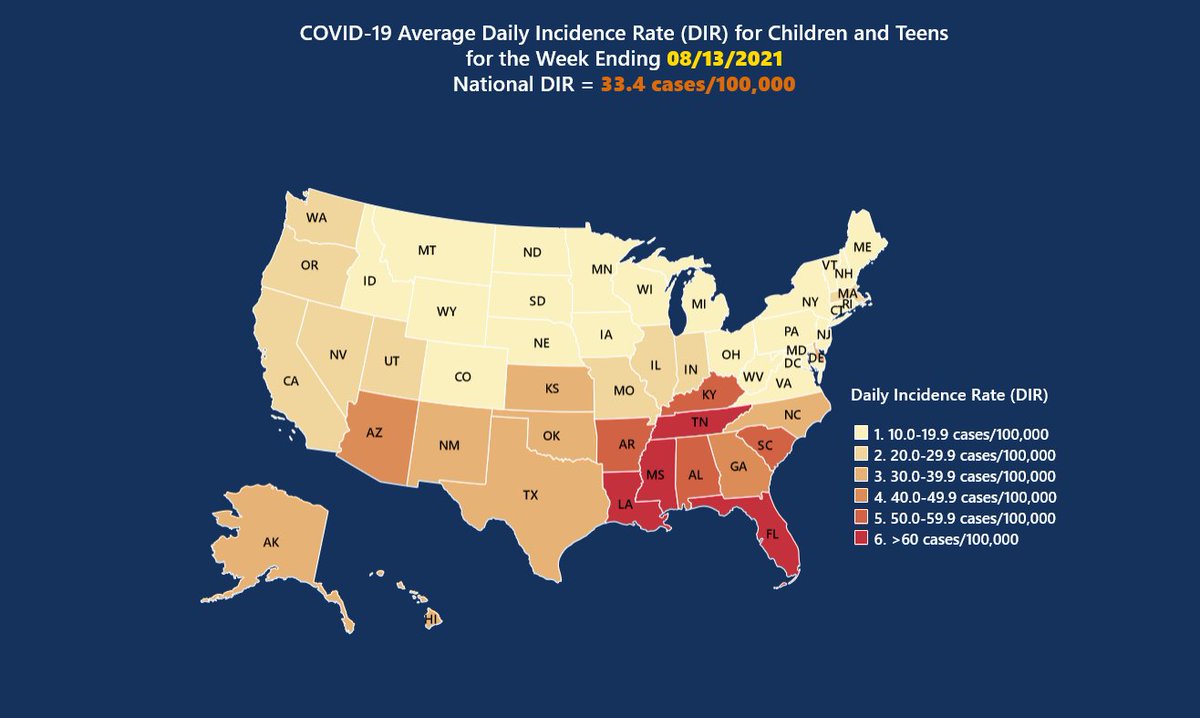
Highest current #COVID19 incidence persists in the US South, Southwest, and Pacific Northwest - also Indiana/Illinois.
covkidproject.org/hot-spots
3/15
Highest current #COVID19 incidence persists in the US South, Southwest, and Pacific Northwest - also Indiana/Illinois.
covkidproject.org/hot-spots

❗ 23-AUG-2021 UPDATE ❗
4/15
Daily incidence rates of #COVID19 in kids ⬇️ in a few states this week, but continue to ⬆️ across all regions of the US.
covkidproject.org/hot-spots
4/15
Daily incidence rates of #COVID19 in kids ⬇️ in a few states this week, but continue to ⬆️ across all regions of the US.
covkidproject.org/hot-spots

❗ 23-AUG-2021 UPDATE ❗
5/15
#COVID19 cases in kids continue to ⬆️ sharply across the Southeast. Mississippi now experiencing higher DIR than Florida.
Additional data for each state in the hover boxes on our dashboard - best viewed on a larger screen.
covkidproject.org/hot-spots
5/15
#COVID19 cases in kids continue to ⬆️ sharply across the Southeast. Mississippi now experiencing higher DIR than Florida.
Additional data for each state in the hover boxes on our dashboard - best viewed on a larger screen.
covkidproject.org/hot-spots

❗ 23-AUG-2021 UPDATE ❗
6/15
#COVID19 cases in kids are ⬆️ most rapidly in Indiana in the Great Lakes region.
covkidproject.org/hot-spots
6/15
#COVID19 cases in kids are ⬆️ most rapidly in Indiana in the Great Lakes region.
covkidproject.org/hot-spots

❗ 23-AUG-2021 UPDATE ❗
7/15
After months of declines, #COVID19 cases in kids are again ⬆️ sharply in the Southwest, and may exceed winter surge highs if present trends continue.
covkidproject.org/hot-spots
7/15
After months of declines, #COVID19 cases in kids are again ⬆️ sharply in the Southwest, and may exceed winter surge highs if present trends continue.
covkidproject.org/hot-spots

❗ 23-AUG-2021 UPDATE ❗
8/15
#COVID19 cases in kids are surging in the Far West - DIR is many times higher in Hawaii than it has ever been before.
covkidproject.org/hot-spots
8/15
#COVID19 cases in kids are surging in the Far West - DIR is many times higher in Hawaii than it has ever been before.
covkidproject.org/hot-spots

❗ 23-AUG-2021 UPDATE ❗
9/15
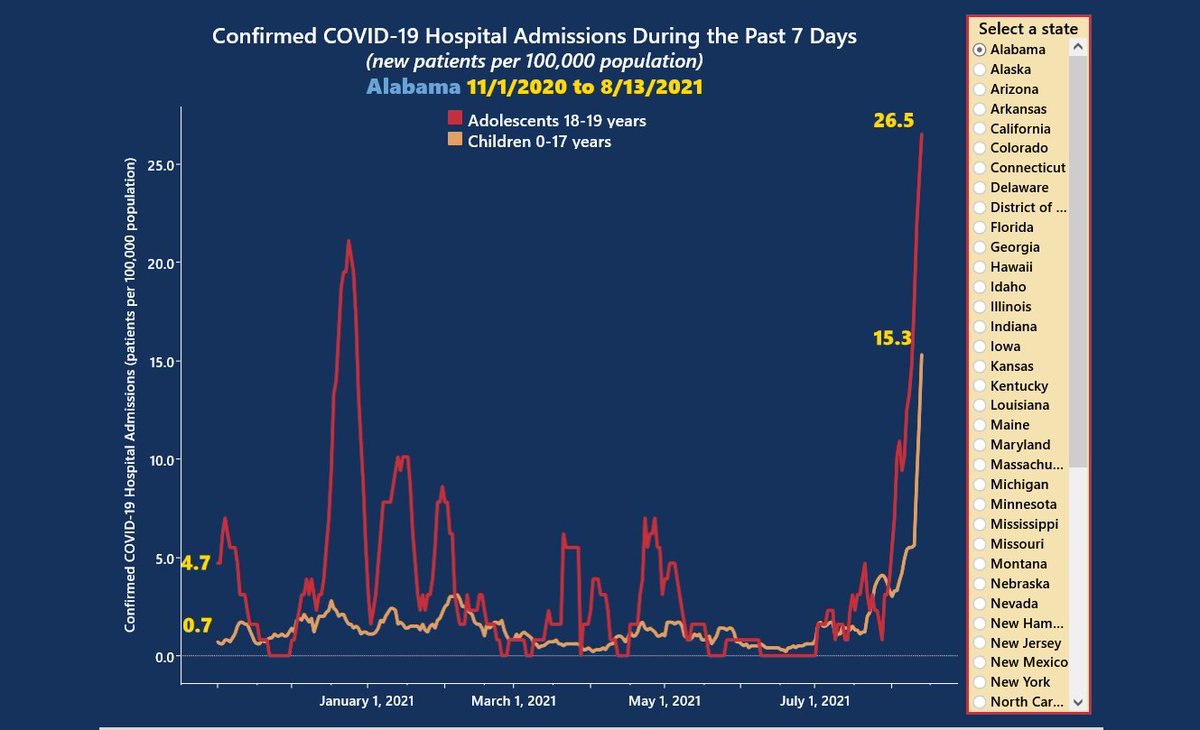
New hospital admissions for #COVID19 continue to ⬆️ among children, but ⬇️ slightly in 18-19 year olds compared to last week.
covkidproject.org/hospitalizatio…
9/15
New hospital admissions for #COVID19 continue to ⬆️ among children, but ⬇️ slightly in 18-19 year olds compared to last week.
covkidproject.org/hospitalizatio…

❗ 23-AUG-2021 UPDATE ❗
10/15
NEW VISUALIZATION ❗
You can now view current pediatric #COVID19 hospitalizations by state - remember these data only go back to last fall - no data at all for first 6 pandemic months.
covkidproject.org/hospitalizatio…
10/15
NEW VISUALIZATION ❗
You can now view current pediatric #COVID19 hospitalizations by state - remember these data only go back to last fall - no data at all for first 6 pandemic months.
covkidproject.org/hospitalizatio…

❗ 23-AUG-2021 UPDATE ❗
11/15
Past 7 day admission trends for #COVID19 in children and 18-19 year olds reveal many states with very adverse trends.
covkidproject.org/hospitalizatio…
11/15
Past 7 day admission trends for #COVID19 in children and 18-19 year olds reveal many states with very adverse trends.
covkidproject.org/hospitalizatio…

❗ 23-AUG-2021 UPDATE ❗
12/15
Cumulative #COVID19 death data reveal that infants suffer the highest mortality rates, followed by 18-19 year olds, and 12-17 year olds. Children 1-11 years have the lowest death rates.
covkidproject.org/deaths
12/15
Cumulative #COVID19 death data reveal that infants suffer the highest mortality rates, followed by 18-19 year olds, and 12-17 year olds. Children 1-11 years have the lowest death rates.
covkidproject.org/deaths

❗ 23-AUG-2021 UPDATE ❗
13/15
#COVID19 racial/ethnic disparities dashboard has been updated with deaths through 8/14/21.
Excess compared with whites:
6-fold for Indigenous kids
3-fold for Black kids
2.5-fold for Hispanic kids
covkidproject.org/disparities
13/15
#COVID19 racial/ethnic disparities dashboard has been updated with deaths through 8/14/21.
Excess compared with whites:
6-fold for Indigenous kids
3-fold for Black kids
2.5-fold for Hispanic kids
covkidproject.org/disparities

❗ 23-AUG-2021 UPDATE ❗
14/15
Finally, the majority of kids 12-17 years old remain NOT fully vaxxed against #COVID19. Darker = higher percent unvaxxed. Remember only full vaccination is protective against #DeltaVariant
covkidproject.org/vaccinations
14/15
Finally, the majority of kids 12-17 years old remain NOT fully vaxxed against #COVID19. Darker = higher percent unvaxxed. Remember only full vaccination is protective against #DeltaVariant
covkidproject.org/vaccinations

❗ 23-AUG-2021 UPDATE ❗
15/15
Thanks to the COVKID Team, esp Dr. Jason Salemi for creating the hospitalization templates.
Thank you for sharing these data widely. #epitwitter #PedsICU @SapnaKmd @heather_haq @Arrianna_Planey @Cleavon_MD @DrEricDing @drkomanduri @Bob_Wachter
15/15
Thanks to the COVKID Team, esp Dr. Jason Salemi for creating the hospitalization templates.
Thank you for sharing these data widely. #epitwitter #PedsICU @SapnaKmd @heather_haq @Arrianna_Planey @Cleavon_MD @DrEricDing @drkomanduri @Bob_Wachter
• • •
Missing some Tweet in this thread? You can try to
force a refresh


