SPECIAL NOTE ON TEXAS
1/9
Please be advised that the @CDCgov covid tracker trend data on #COVID19 by age in Texas are WRONG. CDC draws case data from their case line data file, and TX has reported age on only 3% of total cases.
1/9
Please be advised that the @CDCgov covid tracker trend data on #COVID19 by age in Texas are WRONG. CDC draws case data from their case line data file, and TX has reported age on only 3% of total cases.
SPECIAL NOTE ON TEXAS
2/9
CDC graphic is inadequately footnoted and does not disclose the very low case count behind their trend chart.
Their chart displays no new cases in TX in past 4 months!
@CDCgov should remove this highly inaccurate graphic from their website.
2/9
CDC graphic is inadequately footnoted and does not disclose the very low case count behind their trend chart.
Their chart displays no new cases in TX in past 4 months!
@CDCgov should remove this highly inaccurate graphic from their website.
SPECIAL NOTE ON TEXAS
3/9
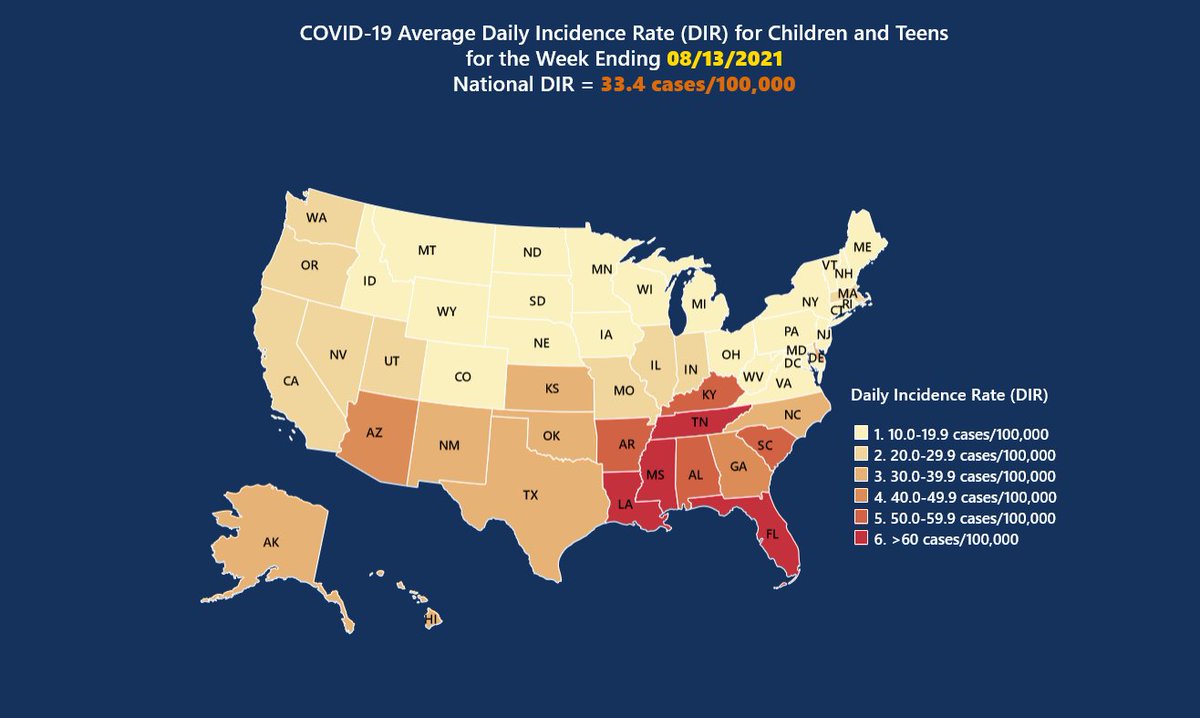
COVKID Project estimates child/teen cases in TX every week using total cases from TX dashboard, and % child/teen from Harris County. Thank you @hcphtx for doing the job your state health dept has neglected! 🙏🏽
3/9
COVKID Project estimates child/teen cases in TX every week using total cases from TX dashboard, and % child/teen from Harris County. Thank you @hcphtx for doing the job your state health dept has neglected! 🙏🏽
SPECIAL NOTE ON TEXAS
4/9
We estimate >536,000 cumulative cases in 0-19 year olds in TX. Our estimate is low because it is based on confirmed cases only; does not include probables.
See cumulative incidence map:
covkidproject.org
4/9
We estimate >536,000 cumulative cases in 0-19 year olds in TX. Our estimate is low because it is based on confirmed cases only; does not include probables.
See cumulative incidence map:
covkidproject.org
SPECIAL NOTE ON TEXAS
5/9
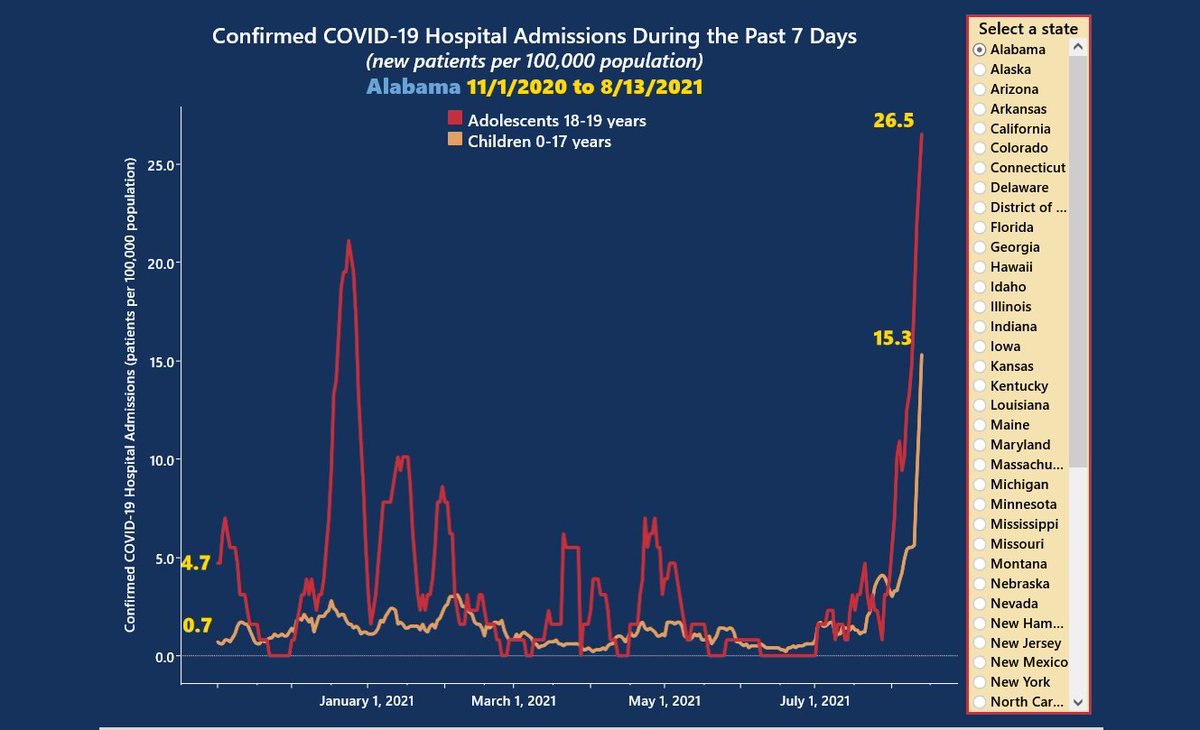
Compare these two charts - best estimate from us (dark blue) vs. garbage reporting from @CDCgov with no warnings or caveats.
5/9
Compare these two charts - best estimate from us (dark blue) vs. garbage reporting from @CDCgov with no warnings or caveats.


SPECIAL NOTE ON TEXAS
6/9
We don’t expect the IT guys contracted by @CDCgov to run their website to understand these problems.
However, the fact that grossly inaccurate data on #COVID19 in kids in the 2nd largest state is displayed publicly reveals a shocking lack ...
6/9
We don’t expect the IT guys contracted by @CDCgov to run their website to understand these problems.
However, the fact that grossly inaccurate data on #COVID19 in kids in the 2nd largest state is displayed publicly reveals a shocking lack ...
SPECIAL NOTE ON TEXAS
7/9
... of oversight by expert epidemiologists.
This is UNACCEPTABLE.
Highly misleading and inaccurate data should not be on @CDCgov website in August 2021.
7/9
... of oversight by expert epidemiologists.
This is UNACCEPTABLE.
Highly misleading and inaccurate data should not be on @CDCgov website in August 2021.
SPECIAL NOTE ON TEXAS
8/9
If you care at all about #COVID19 in children and teens in #Texas, where there have already been 59 deaths reported, please share this thread with anyone who may have the power to impact this problem.
#epitwitter #PedsICU #nahj #nabj #DeltaVariant
8/9
If you care at all about #COVID19 in children and teens in #Texas, where there have already been 59 deaths reported, please share this thread with anyone who may have the power to impact this problem.
#epitwitter #PedsICU #nahj #nabj #DeltaVariant
SPECIAL NOTE ON TEXAS
9/9
@CDCDirector this is your direct responsibility.
@PeterHotez @heather_haq @Cleavon_MD @TexasTribune @pubhealthwatch @DrEricDing @EricTopol @CT_Bergstrom
@RepSylviaGarcia
@MVGutierrezMD @DataDrivenMD
@jamesrhenson
@DataGeekB
@txstateteachers
9/9
@CDCDirector this is your direct responsibility.
@PeterHotez @heather_haq @Cleavon_MD @TexasTribune @pubhealthwatch @DrEricDing @EricTopol @CT_Bergstrom
@RepSylviaGarcia
@MVGutierrezMD @DataDrivenMD
@jamesrhenson
@DataGeekB
@txstateteachers
• • •
Missing some Tweet in this thread? You can try to
force a refresh