The model from @TonyBlakely_PI of the Population Interventions Unit, released yesterday, comes to some surprising conclusions, for example that Stage 4 lockdowns would continue to be necessary even if 95% 16+ are vaccinated.
Thread
1/🧵
#COVID19Vic
…ninterventions.science.unimelb.edu.au/pandemic-trade…
Thread
1/🧵
#COVID19Vic
…ninterventions.science.unimelb.edu.au/pandemic-trade…
I’ve attempted to summarize the differences between the model released yesterday by Melbourne Uni’s Population Interventions Unit (PIU) and the modelling by the Doherty Institute for the National Plan.
2/🧵
2/🧵
PIU provide a very nice web interface that allows the user to explore the effect of different scenarios on the model outcomes. I encourage you to have a look!
…ninterventions.science.unimelb.edu.au/pandemic-trade…
3/🧵
…ninterventions.science.unimelb.edu.au/pandemic-trade…
3/🧵
The PIU model produces significantly more pessimistic outcomes than the Doherty model. For example, Doherty predicts that, for optimal test/trace/isolate/quarantine (TTIQ), lockdowns would become laregly unnecessary beyond 70% double-dose vaccination of the 16+ population.
5/🧵
5/🧵
PIU predicts a significant time in lockdown will be necessary even if 95% of adults are vaccinated.
6/🧵
6/🧵
I’ve summarized the differences graphically here.
Plotted are roughly* the expected observed reproduction number (R_eff) for various restriction levels and vaccination levels for the two models.
*not exact; methodology in the following tweets.
7/🧵
Plotted are roughly* the expected observed reproduction number (R_eff) for various restriction levels and vaccination levels for the two models.
*not exact; methodology in the following tweets.
7/🧵

Both PIU and Doherty predict that Stage 4 lockdown/high PHSM can achieve R<1 at 50% vaccination.
However, PIU predicts Stage 3 lockdown cannot achieve R<1 until >90% vaccination of 16+, while Doherty gets “medium” PHSMs could achieve R<1 at ~50% vax of 16+ (optimal TTIQ)
8/🧵
However, PIU predicts Stage 3 lockdown cannot achieve R<1 until >90% vaccination of 16+, while Doherty gets “medium” PHSMs could achieve R<1 at ~50% vax of 16+ (optimal TTIQ)
8/🧵
Surprisingly, PIU predict that even 100% vaccination of 16+ is not sufficient to achieve R=1 without lockdown (stay-at-home orders; Stages 2-4) if R_0 of delta is greater than 5.8.
Their detailed simulations concur.
9/🧵
Their detailed simulations concur.
9/🧵
The PIU model is an agent-based model, and does not assume a population-wide R_eff. It is calibrated for small outbreaks (effective TTIQ) and then a global multiplier on transmission is applied to match R_eff to observations.
10/🧵
10/🧵
PIU provide this graph which I used to calibrate the reduction in R_eff for various stages of restrictions. Helpfully, the graph indicates that R_eff reductions are the same for a given restriction level, independent of R_0.
11/🧵
11/🧵

I assume vax effectiveness of the mean for the PIU model (71% AZ, 85% Pf). I use the PIU assumption that all 60+ and 25% of 16+ receive AZ, rest Pf. I assumed vax were equally distributed by age (PIU assumed older populations were more highly vaccinated).
12/🧵
12/🧵
Calibration of the Doherty Institute report is described here.
13/🧵
https://twitter.com/MichaelSFuhrer/status/1433211290747498500
13/🧵
Doherty model assumes that transmission is determined by a matrix of probabilities based on age of infected and susceptible individuals. This weights transmission more heavily to working ages, and less towards children and elderly.
14/🧵
14/🧵
They also model various vaccination strategies. I plot the R_eff for the “oldest first” vaccination strategy in the Doherty report.
15/🧵
15/🧵
I also calculate R_eff based on the vax efficacies in the Doherty model, assuming that vax and transmission are equally distributed by age, and using the PIU assumption that all 60+ and 25% of 16+ receive AZ, the rest Pf. This is the “linear” vax model in the plot above.
16/🧵
16/🧵
What accounts for the differences?
Significantly, the PIU model assumes a lower effectiveness of vaccine against onward transmission (25%) compared to Doherty model (~50%). The discussion is given here.
(h/t @7seven_tech)
17/🧵
Significantly, the PIU model assumes a lower effectiveness of vaccine against onward transmission (25%) compared to Doherty model (~50%). The discussion is given here.
(h/t @7seven_tech)
17/🧵

The PIU model assumes an enormous effect of Stage 4 lockdown over Stage 3 lockdown – a 44% reduction in R_eff. This is consistent with the reduction in R_eff observed in Melbourne in 2020 when moving from Stage 3 to Stage 4.
18/🧵
18/🧵
However a mask mandate was also implemented at the same time, and likely accounted for much of the difference, see publication below from @BurnetInstitute.
19/ 🧵
journals.plos.org/plosone/articl…
19/ 🧵
journals.plos.org/plosone/articl…
The PIU model was run under different assumptions for R_0 for delta (5, 6.5, and 8). I’ve chose to use their central value, R = 6.5. On the logarithmic plot, a change of R_0 to 8 would simply shift all lines vertically by an equal amount.
20/🧵
20/🧵
The corresponding R = 1 lines would be at R = 0.81 or R =1.3 on the current plot, for R_0 = 8 or 5, respectively.
21/🧵
21/🧵
Generally the PIU model assumes a smaller effect of baseline public health measures, and a larger effect of measures beyond baseline, compared to Doherty model.
22/🧵
22/🧵
A comparison to “partial TTIQ” in Doherty isn’t possible due to the methodology used by PIU, which assumes a max of 100 contacts/day can be traced. However higher caseloads will raise R_eff at a given vaccination, so in the plot PIU should be treated as "optimal" TTIQ.
23/🧵
23/🧵
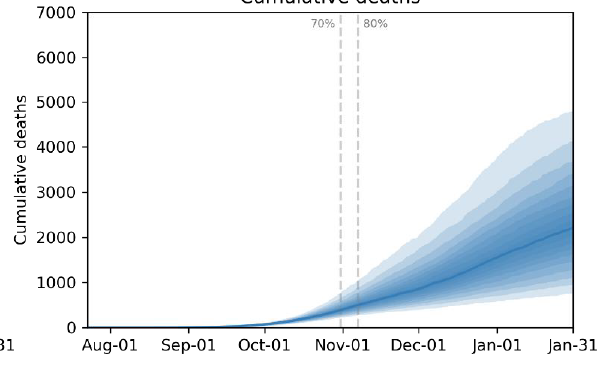
Ultimately, to test the models, we need a real-world test of the effect of removing restrictions, which will be provided soon in NSW at 70% double-dose of 16+.
24/🧵
24/🧵
Notably, PIU would suggest a huge jump in R from 0.7 to 1.7 when NSW goes to approx. Stage 2 at 70% 16+.
(Note, the PIU model is only calibrated for Victoria, but it is difficult to believe that NSW and VIC are qualitatively different.)
25/25🧵
(Note, the PIU model is only calibrated for Victoria, but it is difficult to believe that NSW and VIC are qualitatively different.)
25/25🧵
• • •
Missing some Tweet in this thread? You can try to
force a refresh