I'm trying very hard to understand the Burnet modeling for the VIC roadmap.

The projections seem almost absurdly pessimistic.

#CovidVictoria #CovidVic #roadmap

1/🧵
premier.vic.gov.au/sites/default/…
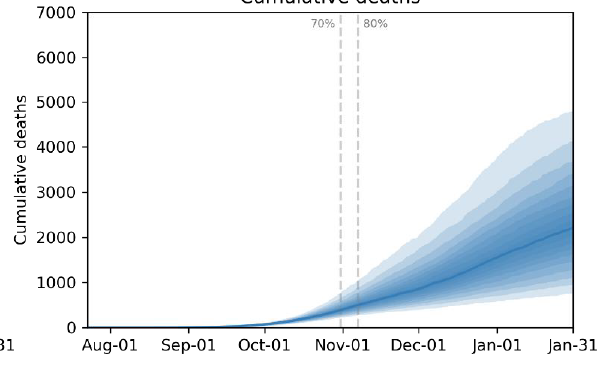
They project, if we follow the re-opening roadmap:
2202 deaths by January (says Dec in table, but clear in the plot it is end of Jan).

I integrated their daily infections, and calculate 330,000 infections from 21 Sept - 31 Jan.

2/🧵
Per capita, that is:

51,076 cases/million = 5.1%
341 deaths/million = 0.034%

An infection fatality ratio of 0.67% (underestimated, as deaths lag cases!)

Ridiculously high for a highly vaccinated population, and comparable to IFR for no vaccination.

3/🧵
For comparison, Denmark (pop. 5.8M) had their delta wave begin in June. Denmark was nearly open (schools, restaurants, museums, events open) and never imposed add'l restrictions for delta, and relaxed all restrictions on 10 September.

4/🧵
Since the delta wave began Denmark has had about 61,659 cases = 10,606/M = 1.06%, and 90 deaths = 15.48/M = 0.0015%, for 0.14% CFR.

5/🧵
To try to compare similar time periods (one month):

The Burnet roadmap predicts for January 2022 cases will be declining, but still there will be:
~75,000 cases = 11,700/M = 1.17%
~700 deaths = 108/M = 0.0108%

6/🧵
Last month in Denmark cases were declining, and there were:
20,494 cases = 3525/M = 0.35%
60 deaths = 10.32/M = 0.0010%
0.29% IFR

1/3 the cases and 1/10 the deaths as Burnet's projection.

And likely to be Denmark's worst month of delta (cases have come down threefold!)

7/🧵
Denmark is highly vaccinated. But VIC will be highly vaccinated in January 2022. In DK over the last month, vaccination proceeded from 67.7% -> 74.4% of total population. Equivalent of 79.6% -> 87.5% of 12+ population. Surely will be comparable in VIC.

8/🧵
Had Burnet modeled DK on 1 July, heading into delta wave with no lockdown, few restrictions, and 34% of population vaxxed, surely they would have predicted a far worse outcome than their VIC projection, yet so far DK has <1/10 deaths compared to Burnet, with waning cases.

9/🧵
I will be extremely surprised if VIC comes anywhere near Burnet's modeling numbers.

10/10🧵

• • •

Missing some Tweet in this thread? You can try to force a refresh
 

Keep Current with Michael S Fuhrer

Michael S Fuhrer Profile picture

Stay in touch and get notified when new unrolls are available from this author!

Read all threads

This Thread may be Removed Anytime!

PDF

Twitter may remove this content at anytime! Save it as PDF for later use!

Try unrolling a thread yourself!

how to unroll video
  1. Follow @ThreadReaderApp to mention us!

  2. From a Twitter thread mention us with a keyword "unroll"
@threadreaderapp unroll

Practice here first or read more on our help page!

More from @MichaelSFuhrer

19 Sep
Today we’ll look around the world at countries which have had success at suppressing covid, the delta strain in particular, and see what lessons there might be for Australia.

Thread.
1/🧵

#COVID19Vic #roadmap #CovidVictoria #COVID19nsw
This thread follows two previous threads on why the UK, and Israel/Alberta, are poor parallels to Australia’s covid situation.

2/🧵
Thread on Israel and Alberta is here.

3/🧵
Read 33 tweets
19 Sep
Some more perspective on the mind-boggling modeling from @BurnetInstitute.

*No country* which has achieved 64% vax of total pop. (equivalent to 80% of 16+) has seen 110 deaths/million population in one month (predicted for VIC in January.

#COVID19Vic
premier.vic.gov.au/sites/default/…
1/
Many countries with high vax, low infection-acquired immunity, and nearly zero restrictions have death rates more than 10X lower (Finland, Norway, Denmark).

Hard to understand why VIC covid deaths should exceed those in other low-covid countries by >10X.

2/
Burnet Institute predicts VIC will see 11,600 cases/M and 110 deaths/M (deaths 0.93% of cases!) in Jan 2022.

Last month (19 Aug-18 Sep):

UK started at 65% total pop vaxxed, had 14,851 *reported* cases/M and 55.5 deaths/M (deadliest mo. of delta; deaths 0.37% of cases).

3/
Read 5 tweets
17 Sep
Yesterday I wrote a long thread on why Australia's path through the delta wave is nothing like the UK's.

I'll continue today to look at some other countries often used as examples of "opening too soon".

Thread.
1/🧵
The current debate centres on NSW's plan to ease restrictions at 70% double-dose vaccination of those aged 16+. That's equivalent to about 56% of the total population, though the added eligibility of 12-15s means more than 56% will have been double-vaccinated by the target.

2/🧵
Here's the plan. Briefly, fully vaccinated people will have access to:
- 5 visitors in a home, gatherings up to 20 outdoors,
- retail, hospitality,gyms, outdoor stadiums at 1 person per 4 m^2,
- weddings and funerals up to 50 guests,
- domestic travel
3/🧵
Read 18 tweets
15 Sep
The UK is often held up as a cautionary tale regarding covid and re-opening.

Let's have a look at what happened in the UK and see if there are parallels to what is happening in Australia.

Thread.
1/🧵
At the beginning of 2021 the UK was fighting a crushing wave of alpha with months of lockdown. As that wave receded, the UK began to release restrictions.

2/🧵
Restrictions were released at a very early stage of the vaccination program:

The UK "picnic day" and end of local-area restrictions to movement occurred on 29 March at 5.6% of total population vaxxed.

Outdoor dining/pubs opened 12 April at 11.5% vax.

3/ 🧵
Read 12 tweets
13 Sep
Some first impressions from the OzSAGE model (ozsage.org/icu-modelling/):

1)Not enough info is given to understand how the model works. They don’t explain how R_eff is calculated, for example, from the restriction settings.

@RichardfromSyd1 @OrinCordus @RageSheen @Globalbiosec
2)They don’t explain their assumptions about ongoing vaccination beyond 80%. This is key to understanding the model and it’s left unstated.
3)They say they adapt a peer-reviewed model, but that model was not used to model time-varying restrictions, and in fact did not include masks or lockdowns at all.
Read 12 tweets
1 Sep
Here is a long/technical thread on my attempt to reverse-engineer the assumptions from the Doherty Institute report to the National Cabinet (linked) regarding delta severity, PHSM effectiveness, and vaccine effectiveness to match observations.
1/🧵
doherty.edu.au/uploads/conten…
Here are the figures from the Doherty Institute report. Note that there are a couple versions of these figures in the report; these assume the “all adults” strategy for vaccination.
2/🧵
The figures attempt to show graphically the effect of various interventions on the transmission potential (TP). TP is in essence R_eff, but calculated on the population level, as I understand it. When TP>1, cases grow, and TP<1, cases decline.
3/🧵
Read 34 tweets

Did Thread Reader help you today?

Support us! We are indie developers!


This site is made by just two indie developers on a laptop doing marketing, support and development! Read more about the story.

Become a Premium Member ($3/month or $30/year) and get exclusive features!

Become Premium

Too expensive? Make a small donation by buying us coffee ($5) or help with server cost ($10)

Donate via Paypal Become our Patreon

Thank you for your support!

Follow Us on Twitter!

:(