Yesterday I wrote a long thread on why Australia's path through the delta wave is nothing like the UK's.
I'll continue today to look at some other countries often used as examples of "opening too soon".
Thread.
1/🧵
I'll continue today to look at some other countries often used as examples of "opening too soon".
Thread.
1/🧵
https://twitter.com/MichaelSFuhrer/status/1438276220311912448
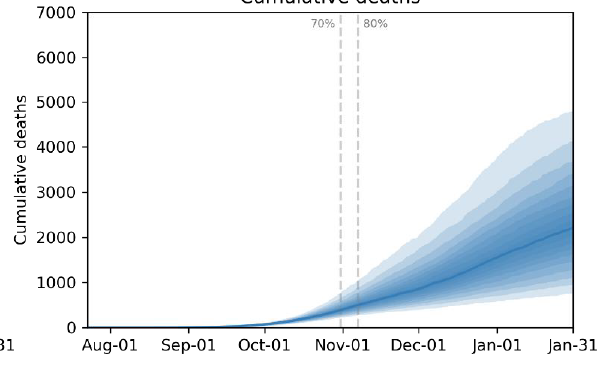
The current debate centres on NSW's plan to ease restrictions at 70% double-dose vaccination of those aged 16+. That's equivalent to about 56% of the total population, though the added eligibility of 12-15s means more than 56% will have been double-vaccinated by the target.
2/🧵
2/🧵
Here's the plan. Briefly, fully vaccinated people will have access to:
- 5 visitors in a home, gatherings up to 20 outdoors,
- retail, hospitality,gyms, outdoor stadiums at 1 person per 4 m^2,
- weddings and funerals up to 50 guests,
- domestic travel
3/🧵
- 5 visitors in a home, gatherings up to 20 outdoors,
- retail, hospitality,gyms, outdoor stadiums at 1 person per 4 m^2,
- weddings and funerals up to 50 guests,
- domestic travel
3/🧵
https://twitter.com/NSWHealth/status/1435774751847305222
Critics of the plan often point to other countries which "opened too soon" and had disastrous delta waves. Yesterday I discussed the UK.
Today we'll look at Israel, and Alberta, Canada.
4/🧵
Today we'll look at Israel, and Alberta, Canada.
4/🧵
https://twitter.com/MichaelSFuhrer/status/1438276220311912448
Israel had a wave of alpha in late 2020/early 2021, and imposed a long and strict lockdown which still failed to prevent a high peak in infections up to nearly 1,000/M/day (equivalent to 8,000/day in NSW).
5/🧵
5/🧵

Israel had an early and vigorous vaccination campaign in Jan-Mar 2021, and the receding alpha wave coincided with the increasing vaccination, which helped to drive down infections further.
6/🧵
6/🧵
Lockdown restrictions were first eased on 7 Feb 2021.
Further easing at 7 Mar (at 43% total pop vaxxed) included:
- Gatherings of 20 indoors/50 outdoors
- Indoor dining up to 100
- Places of worship
- Tourist attractions
Some gatherings required proof of vaccination.
7/🧵
Further easing at 7 Mar (at 43% total pop vaxxed) included:
- Gatherings of 20 indoors/50 outdoors
- Indoor dining up to 100
- Places of worship
- Tourist attractions
Some gatherings required proof of vaccination.
7/🧵

Delta didn't arrive in Israel until June.
The delta wave was a surprise, given the success of vaccination against alpha.
8/🧵
The delta wave was a surprise, given the success of vaccination against alpha.
8/🧵

Major restrictions were never re-imposed (though some restrictions were imposed such as mask requirements and work-from-home).
The resulting delta wave was larger than the alpha wave.
9/ 🧵
The resulting delta wave was larger than the alpha wave.
9/ 🧵

The story in Alberta is similar. I will leave out some details.
Alberta also came out of a non-delta wave as vaccination was starting to take off. However, in this case they set vaccination targets for reopening, in phases, at 50, 60, and 70% *single*-dose vaccination
10/🧵
Alberta also came out of a non-delta wave as vaccination was starting to take off. However, in this case they set vaccination targets for reopening, in phases, at 50, 60, and 70% *single*-dose vaccination
10/🧵
The targets were reached on 1 June, 10 June, 1 July. Delta became dominant in Canada in mid-July.
Alberta initially took some actions to undermine the public health response, including scaling back asymptomatic testing and self-isolation.
11/🧵
Alberta initially took some actions to undermine the public health response, including scaling back asymptomatic testing and self-isolation.
11/🧵
Recently, in the face of a rising delta wave Alberta has done an about-face and reimposed restrictions.
The new restrictions are roughly equivalent to NSW's 70% targets. (Alberta has 71.4% eligible population fully vaccinated.)
12/🧵
cbc.ca/news/canada/ed…
The new restrictions are roughly equivalent to NSW's 70% targets. (Alberta has 71.4% eligible population fully vaccinated.)
12/🧵
cbc.ca/news/canada/ed…
Certainly Israel and Alberta have cautionary tales to tell!
But: Both went into delta with few restrictions, and neither seriously tried to suppress delta with public health measures, though Alberta did eventually re-impose restrictions, in face of higher infections.
13/🧵
But: Both went into delta with few restrictions, and neither seriously tried to suppress delta with public health measures, though Alberta did eventually re-impose restrictions, in face of higher infections.
13/🧵
No doubt some of this was political; in both cases, having crushed a covid wave while vaccination took off, I am certain there was a strong sense in the public and government that vaccination would protect against further waves, and this informed strategy.
14/🧵
14/🧵
I don't mean to open a debate about whether or not this was a good strategy.
The major lesson: Vaccination alone will not control delta.
NSW will need ongoing public health measures, monitoring, and likely targeted actions to suppress delta outbreaks.
15/🧵
The major lesson: Vaccination alone will not control delta.
NSW will need ongoing public health measures, monitoring, and likely targeted actions to suppress delta outbreaks.
15/🧵
Still, NSW will likely achieve much higher vaccination levels than Israel and Alberta.
Israel has 63% total pop vaccinated (equiv <80% of 16+), and Alberta has the lowest vaccination rate in Canada, 71.4% eligible population fully vaccinated.
16/🧵
Israel has 63% total pop vaccinated (equiv <80% of 16+), and Alberta has the lowest vaccination rate in Canada, 71.4% eligible population fully vaccinated.
16/🧵
NSW has so far shown it can suppress delta though public health measures, combined with some vaccination, to achieve R<1 without very high infection-acquired immunity - something Israel and Alberta never did.
17/🧵
17/🧵
What happens when public health measures begin to lift in NSW?
We don't know. But Israel and Alberta aren't good guides.
Next time I will discuss some success stories - countries that have controlled delta with low infections and moderate public health measures.
18/18🧵
We don't know. But Israel and Alberta aren't good guides.
Next time I will discuss some success stories - countries that have controlled delta with low infections and moderate public health measures.
18/18🧵
• • •
Missing some Tweet in this thread? You can try to
force a refresh