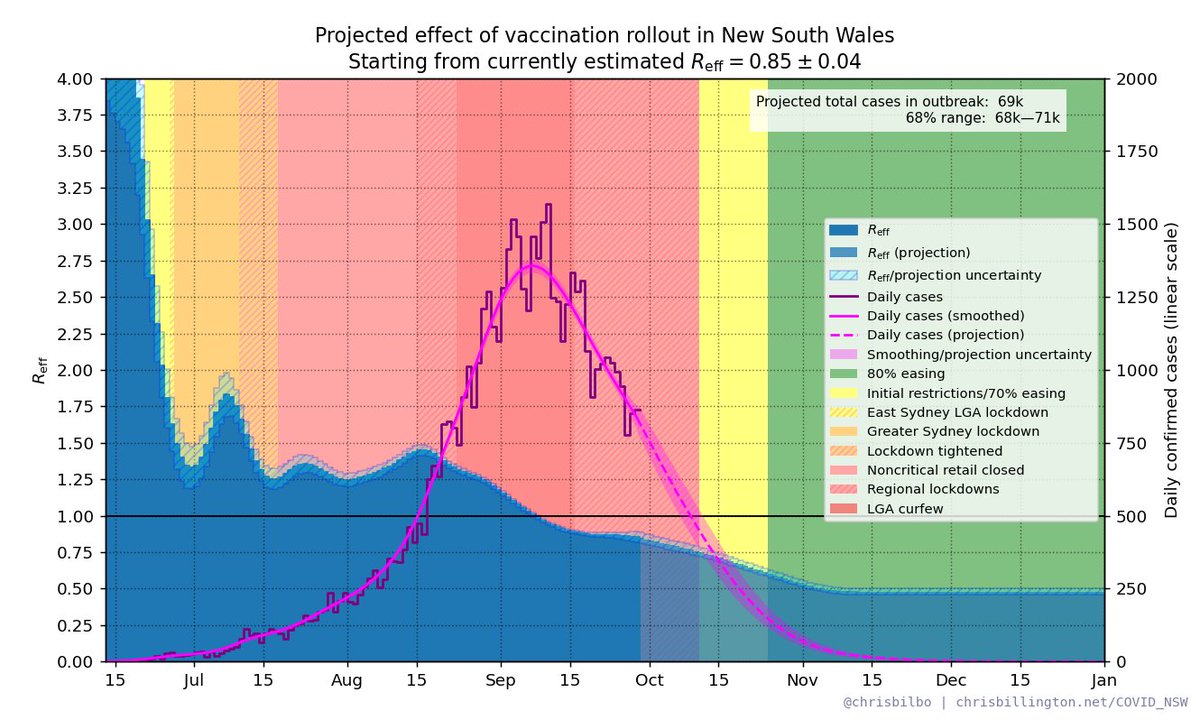
NSW R_eff as of September 30th with daily cases and restrictions. Latest estimate: R_eff = 0.89 ± 0.04

Plus projected effect of vaccination rollout.

Cases shown on a linear scale (log scale in next tweet).

More info chrisbillington.net/COVID_NSW.html

#covid19nsw #covidsydney ImageImage
NSW R_eff as of September 30th with daily cases and restrictions. Latest estimate: R_eff = 0.89 ± 0.04

Plus projected effect of vaccination rollout.

(Cases shown on a log scale)

More info chrisbillington.net/COVID_NSW.html

#covid19nsw #covidsydney ImageImage
R_eff in LGAs of concern* vs the rest of NSW (*all of Penrith included):

LGAs of concern: R_eff = 0.80 ± 0.04
Rest of NSW: R_eff = 0.93 ± 0.05

(Cases shown on a log scale)

(note LGA data is several days old, does not include today's cases)

#covid19nsw #covidsydney ImageImage
The Hunter Region: R_eff = 1.45 ± 0.19

(Cases shown on a log scale)

(note LGA data is several days old, does not include today's cases)

#covid19nsw #covidsydney Image
Expected numbers if the current trend continues:

day cases 68% range
Fri: 820 694—948
Sat: 793 660—933
Sun: 765 621—912
Mon: 736 587—890
Tue: 708 554—871
Wed: 679 523—849
Thu: 651 490—826

Halving time is 29.6 days.
Note that these projections do not take into account upcoming easing of restrictions. If the trend changes as a result of easing, the projections will also change once this is reflected in case numbers, but not in advance. Image

• • •

Missing some Tweet in this thread? You can try to force a refresh
 

Keep Current with Chris Billington

Chris Billington Profile picture

Stay in touch and get notified when new unrolls are available from this author!

Read all threads

This Thread may be Removed Anytime!

PDF

Twitter may remove this content at anytime! Save it as PDF for later use!

Try unrolling a thread yourself!

how to unroll video
  1. Follow @ThreadReaderApp to mention us!

  2. From a Twitter thread mention us with a keyword "unroll"
@threadreaderapp unroll

Practice here first or read more on our help page!

More from @Chrisbilbo

1 Oct
VIC R_eff as of October 2nd with daily cases and restrictions. Latest estimate: R_eff = 1.53 ± 0.09

Plus projected effect of vaccination rollout.

Cases shown on a linear scale (log scale in next tweet).

More info chrisbillington.net/COVID_VIC_2021…

#COVID19Vic ImageImage
VIC R_eff as of October 2nd with daily cases and restrictions. Latest estimate: R_eff = 1.53 ± 0.09

Plus projected effect of vaccination rollout.

(Cases shown on a log scale)

More info chrisbillington.net/COVID_VIC_2021…

#COVID19Vic ImageImage
Expected numbers if the current trend continues:

day cases 68% range
Sun: 1591 1327—1863
Mon: 1739 1409—2100
Tue: 1896 1485—2367
Wed: 2068 1558—2644
Thu: 2246 1635—2952
Fri: 2433 1706—3288
Sat: 2631 1770—3655

Doubling time is 8.2 days.

#COVID19Vic
Read 7 tweets
1 Oct
ACT R_eff as of October 1st with daily cases and restrictions. Latest estimate: R_eff = 1.71 ± 0.53

Plus projected effect of vaccination rollout.

Cases shown on a linear scale (log scale in next tweet).

More info chrisbillington.net/COVID_ACT.html ImageImage
ACT R_eff as of October 1st with daily cases and restrictions. Latest estimate: R_eff = 1.71 ± 0.53

Plus projected effect of vaccination rollout.

(Cases shown on a log scale)

More info chrisbillington.net/COVID_ACT.html ImageImage
Expected numbers if the current trend continues:

day cases 68% range
Sat: 44 14—81
Sun: 49 12—100
Mon: 55 10—124
Tue: 60 5—150
Wed: 66 4—183
Thu: 72 0—220
Fri: 78 0—262

Doubling time is 6.5 days.
Read 4 tweets
1 Oct
NSW R_eff as of October 1st with daily cases and restrictions. Latest estimate: R_eff = 0.91 ± 0.04

Plus projected effect of vaccination rollout.

Cases shown on a linear scale (log scale in next tweet).

More info chrisbillington.net/COVID_NSW.html

#covid19nsw #covidsydney ImageImage
NSW R_eff as of October 1st with daily cases and restrictions. Latest estimate: R_eff = 0.91 ± 0.04

Plus projected effect of vaccination rollout.

(Cases shown on a log scale)

More info chrisbillington.net/COVID_NSW.html

#covid19nsw #covidsydney ImageImage
R_eff in LGAs of concern* vs the rest of NSW (*all of Penrith included):

LGAs of concern: R_eff = 0.80 ± 0.04
Rest of NSW: R_eff = 0.96 ± 0.05

(Cases shown on a log scale)

(note LGA data is several days old, does not include today's cases)

#covid19nsw #covidsydney ImageImage
Read 6 tweets
1 Oct
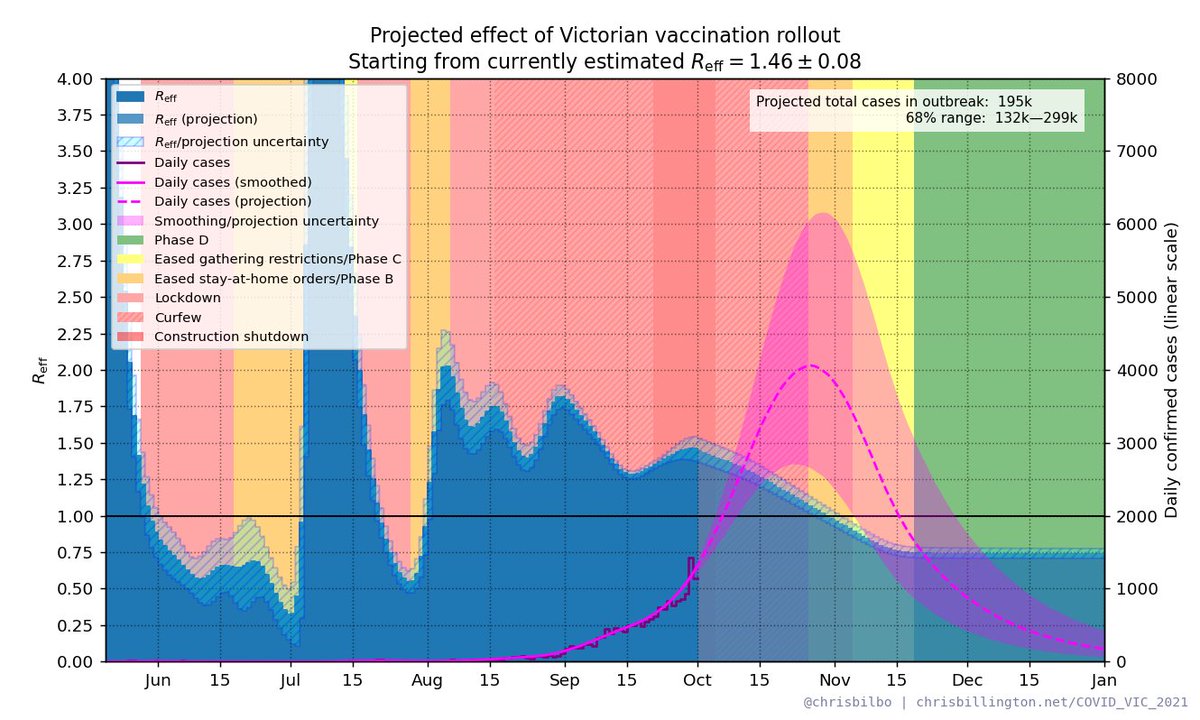
VIC R_eff as of October 1st with daily cases and restrictions. Latest estimate: R_eff = 1.46 ± 0.08

Plus projected effect of vaccination rollout.

Cases shown on a linear scale (log scale in next tweet).

More info chrisbillington.net/COVID_VIC_2021…

#COVID19Vic ImageImage
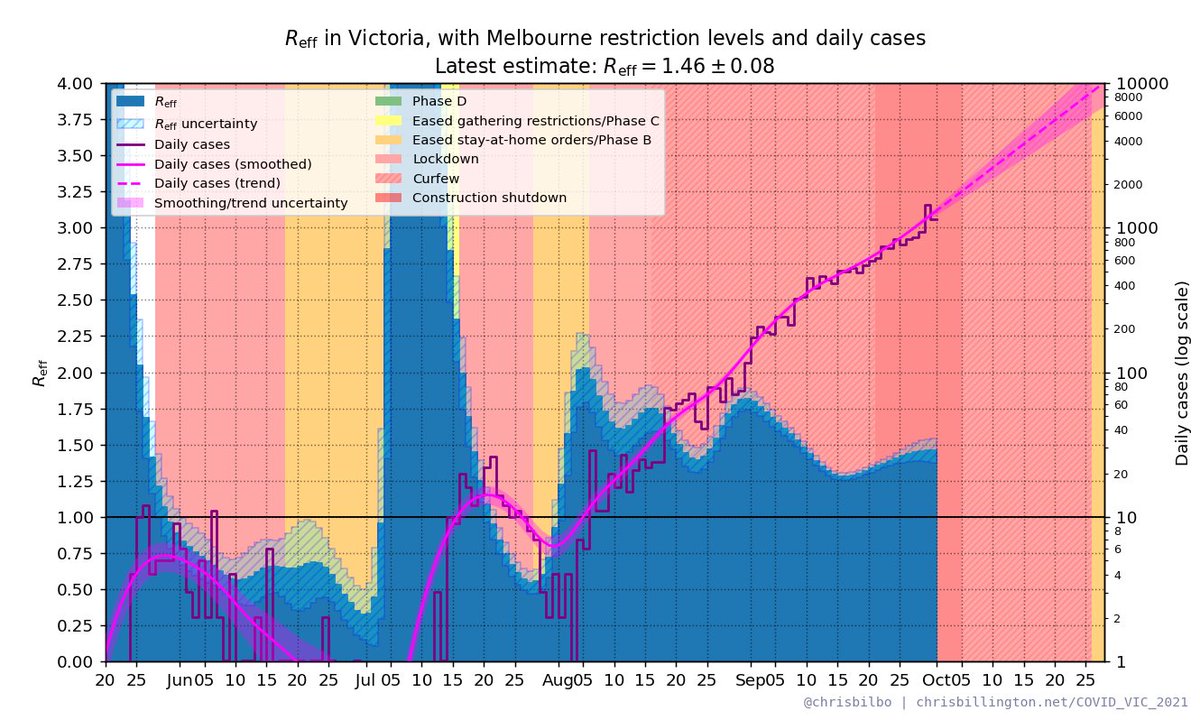
VIC R_eff as of October 1st with daily cases and restrictions. Latest estimate: R_eff = 1.46 ± 0.08

Plus projected effect of vaccination rollout.

(Cases shown on a log scale)

More info chrisbillington.net/COVID_VIC_2021…

#COVID19Vic ImageImage
Expected numbers if the current trend continues:

day cases 68% range
Sat: 1373 1146—1591
Sun: 1482 1205—1765
Mon: 1597 1253—1961
Tue: 1718 1309—2161
Wed: 1844 1359—2374
Thu: 1979 1399—2608
Fri: 2110 1443—2866

Doubling time is 9.2 days.

#COVID19Vic
Read 5 tweets
29 Sep
VIC R_eff as of September 30th with daily cases and restrictions. Latest estimate: R_eff = 1.50 ± 0.09

Plus projected effect of vaccination rollout.

Cases shown on a linear scale (log scale in next tweet).

More info chrisbillington.net/COVID_VIC_2021…

#COVID19Vic ImageImage
VIC R_eff as of September 30th with daily cases and restrictions. Latest estimate: R_eff = 1.50 ± 0.09

Plus projected effect of vaccination rollout.

(Cases shown on a log scale)

More info chrisbillington.net/COVID_VIC_2021…

#COVID19Vic ImageImage
Expected numbers if the current trend continues:

day cases 68% range
Fri: 1322 1099—1557
Sat: 1441 1156—1738
Sun: 1565 1213—1941
Mon: 1694 1265—2161
Tue: 1833 1317—2414
Wed: 1977 1370—2669
Thu: 2130 1424—2953

Doubling time is 8.6 days.

#COVID19Vic
Read 5 tweets
29 Sep
NSW R_eff as of September 29th with daily cases and restrictions. Latest estimate: R_eff = 0.85 ± 0.04

Plus projected effect of vaccination rollout.

Cases shown on a linear scale (log scale in next tweet).

More info chrisbillington.net/COVID_NSW.html

#covid19nsw #covidsydney ImageImage
NSW R_eff as of September 29th with daily cases and restrictions. Latest estimate: R_eff = 0.85 ± 0.04

Plus projected effect of vaccination rollout.

(Cases shown on a log scale)

More info chrisbillington.net/COVID_NSW.html

#covid19nsw #covidsydney ImageImage
R_eff in LGAs of concern* vs the rest of NSW (*all of Penrith included):

LGAs of concern: R_eff = 0.80 ± 0.04
Rest of NSW: R_eff = 0.97 ± 0.05

(Cases shown on a log scale)

(note LGA data is several days old, does not include today's cases)

#covid19nsw #covidsydney ImageImage
Read 5 tweets

Did Thread Reader help you today?

Support us! We are indie developers!


This site is made by just two indie developers on a laptop doing marketing, support and development! Read more about the story.

Become a Premium Member ($3/month or $30/year) and get exclusive features!

Become Premium

Too expensive? Make a small donation by buying us coffee ($5) or help with server cost ($10)

Donate via Paypal Become our Patreon

Thank you for your support!

Follow Us on Twitter!

:(