1) % of $XAU stocks > their 200D MAs has been 0% 10D in a row (went to 3% for 2D after this tweet). $GDX $GDXJ
So 10D MA of % of XAU stocks > 200D MA is also 0%.
Here are the days since '02 when this first occurred ...
$SPY $QQQ $TLT $GLD #Commodities
So 10D MA of % of XAU stocks > 200D MA is also 0%.
Here are the days since '02 when this first occurred ...
$SPY $QQQ $TLT $GLD #Commodities
https://twitter.com/ResearchQf/status/1439997787056320512
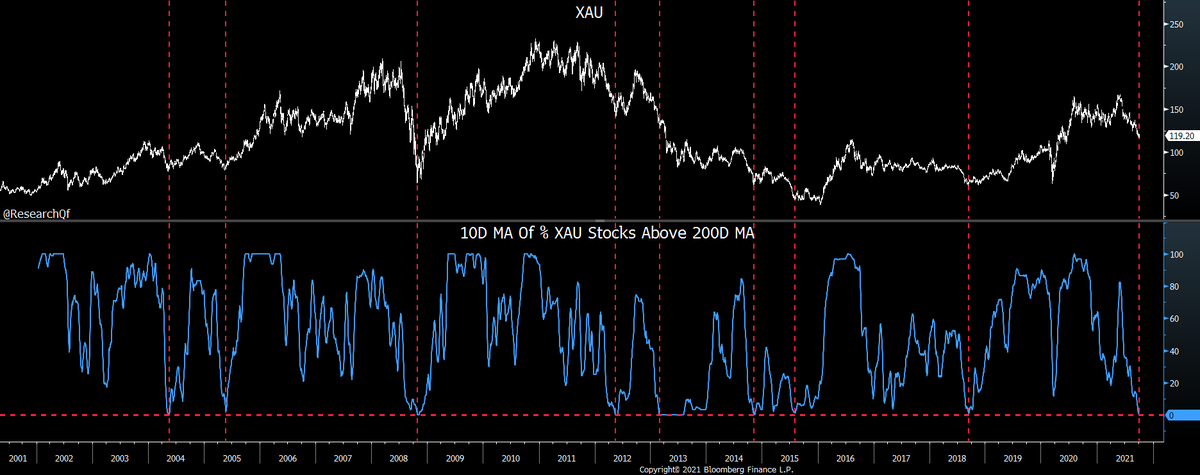
2) (or came very very close).
9/17/18 (0% 10D MA)
8/5/15 (1%)
11/10/14 (0%)
3/5/13 (0%)
5/16/12 (0%)
10/29/08 (0%)
5/24/05 (2%)
5/18/04 (0%)
Every date not far from a major IT or LT low with that BIG exception in '13 (see posts about '13 last 6M).
10D stayed at 0% in '13 ...
9/17/18 (0% 10D MA)
8/5/15 (1%)
11/10/14 (0%)
3/5/13 (0%)
5/16/12 (0%)
10/29/08 (0%)
5/24/05 (2%)
5/18/04 (0%)
Every date not far from a major IT or LT low with that BIG exception in '13 (see posts about '13 last 6M).
10D stayed at 0% in '13 ...
3) for 5M and XAU fell 36% more before an IT low.
Besides '13 the low was usually a few days before these dates.
Different info in 10D charts. Fidelity is lost. E.g. Mar '20 doesn't show as selloff was so sharp.
Doesn't hurt GDXJ up > 1% while GLD down > 0.4% today. That's ...
Besides '13 the low was usually a few days before these dates.
Different info in 10D charts. Fidelity is lost. E.g. Mar '20 doesn't show as selloff was so sharp.
Doesn't hurt GDXJ up > 1% while GLD down > 0.4% today. That's ...
4) happened twice since volatility last spring (used to be more common). The 2 days were 8/12/20 and 10/29/20, which led to ST bounces.
So maybe a ST tailwind + strong LT tailwind?
For the 20th time, this isn't 2013. Even more to discuss regarding '13 but another time.
So maybe a ST tailwind + strong LT tailwind?
For the 20th time, this isn't 2013. Even more to discuss regarding '13 but another time.
5) Worth mentioning that cost of $GLD puts vs calls 20D MA is highest in years right now (and higher than in early Apr and Jul after bigger $gold selloffs).
$SPY $QQQ $TLT $GDX #Commodities
$SPY $QQQ $TLT $GDX #Commodities
https://twitter.com/ResearchQf/status/1443228771075575813
6) E.g. in early Apr.
A single indicator is never perfect. Just risk/reward but adds to the IT/LT lean.
A single indicator is never perfect. Just risk/reward but adds to the IT/LT lean.
https://twitter.com/ResearchQf/status/1379176473496522754
7) $GDXJ up > 0.5% but $GLD down > 0.5% (slightly different conditions vs 3).
Occurred just once since volatility last spring! 11/27/20. I remember the day.
Again more common before Apr '20. ST/IT risk/reward was positive. Btw risk/reward = ...
$SPY $QQQ $TLT $GLD #Commodities
Occurred just once since volatility last spring! 11/27/20. I remember the day.
Again more common before Apr '20. ST/IT risk/reward was positive. Btw risk/reward = ...
$SPY $QQQ $TLT $GLD #Commodities
8) risk/reward. Not certainty.
Cost of GLD puts vs calls 20D MA hit another multi-Y high today. Again higher than early Apr/Jul despite a shallower gold correction.
Yes NFP tomorrow can cause noise but these ST tailwinds and stronger LT tailwinds from 1) etc might be lasting.
Cost of GLD puts vs calls 20D MA hit another multi-Y high today. Again higher than early Apr/Jul despite a shallower gold correction.
Yes NFP tomorrow can cause noise but these ST tailwinds and stronger LT tailwinds from 1) etc might be lasting.
• • •
Missing some Tweet in this thread? You can try to
force a refresh