This thread summarizes key findings of our report iitk.ac.in/dord/up_covid1….
What is the UP Model? At its heart is the decision not to shut down the economy during the second wave. This helps weaker sections of society as they are the worst sufferers of a lockdown.
What is the UP Model? At its heart is the decision not to shut down the economy during the second wave. This helps weaker sections of society as they are the worst sufferers of a lockdown.
An additional benefit is that the returning migrant workers can find employment more easily. The downside is also substantial. The pandemic may get totally out of control since people are moving about and interacting. This would lead to a collapse of health infrastructure.
This makes controlling the pandemic so it does not go out of control of utmost importance. This has to be supplemented with a rapid expansion of health infrastructure to take care of increased patient load.
Our report took data from multiple sources & analyzed them to conclude how successful was the model. At several places, SUTRA model has been used for analysis purposes. For those interested, a significantly updated version of our paper on the model is at arxiv.org/abs/2101.09158
First the economy. More than 2.6 lakh NOCs were issued to new enterprises during the pandemic period in the state. Large scale skill mapping was undertaken for migrant workers and shared with potential employers. These and other steps significantly impacted unemployment rates.
As the plot shows, unemployment rate in the state came down from ~10% in March 2020 to ~4% in June 2021! A sharp contrast with pan-India and states of Bihar and Delhi plotted here (source: CMIE Prowess Unemployment Database). 

To support weaker sections, about 39 lakh metric tonnes of free ration was distributed to them during the second wave. This translates to more than 100 kg per family. Besides, a cash transfer of ~3K per family was done.
Healthcare manpower was significantly augmented by training ASHA and Anganwadi workers. The workers were provided special medical insurance and incentives to keep their motivation high. Innovative methods were used to expand the availability of Covid-beds to almost 80,000.
This met the requirements except for a brief period around the peak.
Oxygen became a very precious resource during the second wave. In about 12 days in second half of April, the demand nearly tripled, going way past the generation capacity of the state.
Oxygen became a very precious resource during the second wave. In about 12 days in second half of April, the demand nearly tripled, going way past the generation capacity of the state.
Plenty of Oxygen was available in plants near east or west coast, the challenge was how to transport it quickly to the state because Oxygen tankers move very slowly on road.
Again, some out-of-box thinking helped. Empty tankers were airlifted by IAF transport planes to generation plants and filled tankers were loaded on special trains to bring them back quickly (they were too heavy to be brought by planes).
A centralized dashboard live tracked all the tankers. In addition, to rationalize the consumption, @IITKanpur was roped in to create a real-time Oxygen audit system for hospitals in the state. It resulted in savings of 30+ MT per day.
These steps resulted in supply outstripping demand within 2 weeks as shown in the plot below.

Finally, for the most critical aspect of controlling the pandemic, a number of strategies were deployed. Every village had monitoring committee that was given a basic medication kit to be given to anyone suspected of being ill.
Besides, house-to-house visits were conducted to identify possible cases. A clear home isolation protocol was put in place for mild cases. In cities, micro-containment zones were dynamically created to limit the outbreak without effecting economic activity much.
Restrictions were put during weekends and nights on movement. These measures brought down contact rate from 0.6 to 0.3. The reduced contact rate was roughly the same as achieved by most states with a strict lockdown!
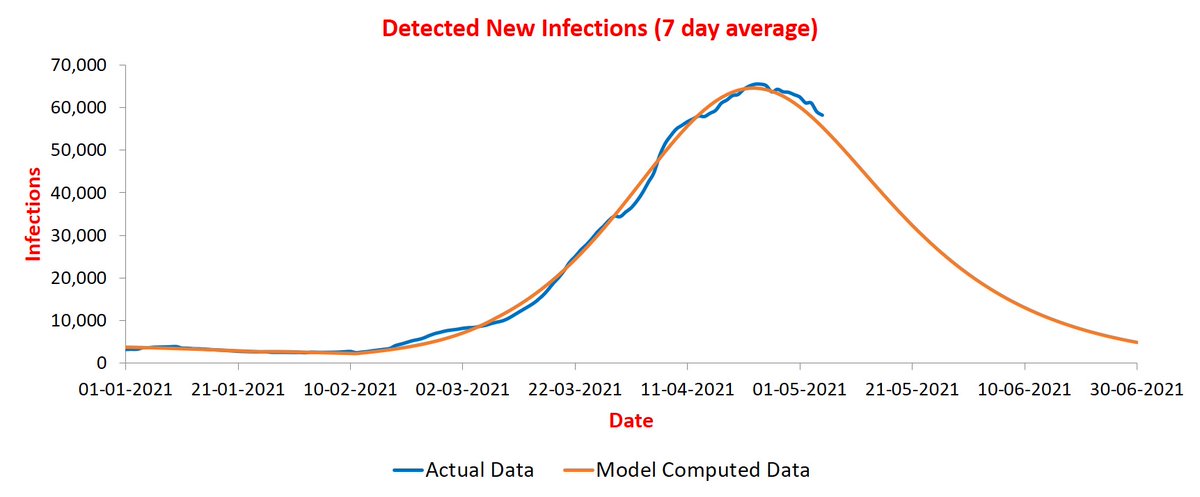
The reduction in contact rate caused the peak of infections to also reduce by a factor of two as shown in the plot below. The red and orange curves have been computed using SUTRA model.

The timing of the restriction steps is also crucial. Could an earlier imposition have led to further reduction? Our analysis shows no. In addition, it shows that even a slight delay would have resulted in large increase!
We compared the timing of measures in UP with many other states. In the plot below, states within green and red circles got the timing wrong: green were too early and red were too late.

Note that some states occur twice with postfix M and S. They first imposed Mild restrictions and later Strict Lockdowns. Only five states got the timing about right: UP, Assam (M), Telangana (M), Gujarat, and Maharashtra (M). Among these, UP was spot on!
Another critical component of control was testing. There are two broad strategies for testing. First is targeted testing focusing on symptomatic cases. Second is chasing the pandemic by testing extensively.
To identify the strategy followed by a state, test positivity rate (TPR) is used often. However, there is a better method: to use normalized test positivity rate (NTPR). It is defined to be the ratio of TPR and percentage of active cases.
For targeted testing, NTPR will be significantly more than one (finding many more cases than a random test would do) and when chasing the pandemic, NTPR will be significantly less than one (finding much fewer cases that a random test would do).
SUTRA model allows one to estimate percentage of active cases at any time, thus NTPR can be computed. Plot below shows the progression of NTPR for UP (size of circles denotes NTPR value at the time). As is clearly evident, UP has consistently chased the pandemic!

In contrast, Maharashtra has consistently followed targeted testing as evident from the plot below.

Kerala has an interesting mix. It chased the pandemic last year, but has shifted to targeted testing during second wave.

The chasing the pandemic strategy contributed towards not allowing uncontrolled growth in the number of cases.
Above were salient points of the UP Model and our analysis of it. Despite all these steps, there was a period of about two weeks in April-May when cases were high, there was Oxygen shortage, and there were many deaths. Could this have been avoided?
There is always possibility of improvement, especially in hindsight. At the same time, it needs to be borne in mind that delta is an extremely virulent mutant. It has caused chaos wherever it has gone.
Some countries got away with less damage due to high vaccination (e.g. UK), while some others suffered majorly (e.g. US). This is despite the fact that they had time to prepare for delta and had significantly more resources too.
There have been reports about significantly more deaths in UP (and elsewhere) than recorded. Nearly all of them are either anecdotal or use partial data. One needs CRS data for 2021, compare growth from 2020 against the trend of past decade to estimate excess deaths.
This exercise needs to wait until early next year when 2021 data will become available. Growth from 2019 to 2020 in UP was ~3% which is about same as trend since 2011. This implies that at least in the first wave, number of Covid-deaths were not significantly more than reported.
• • •
Missing some Tweet in this thread? You can try to
force a refresh