#Ethereum #Bitcoin #BTC #Cryptos
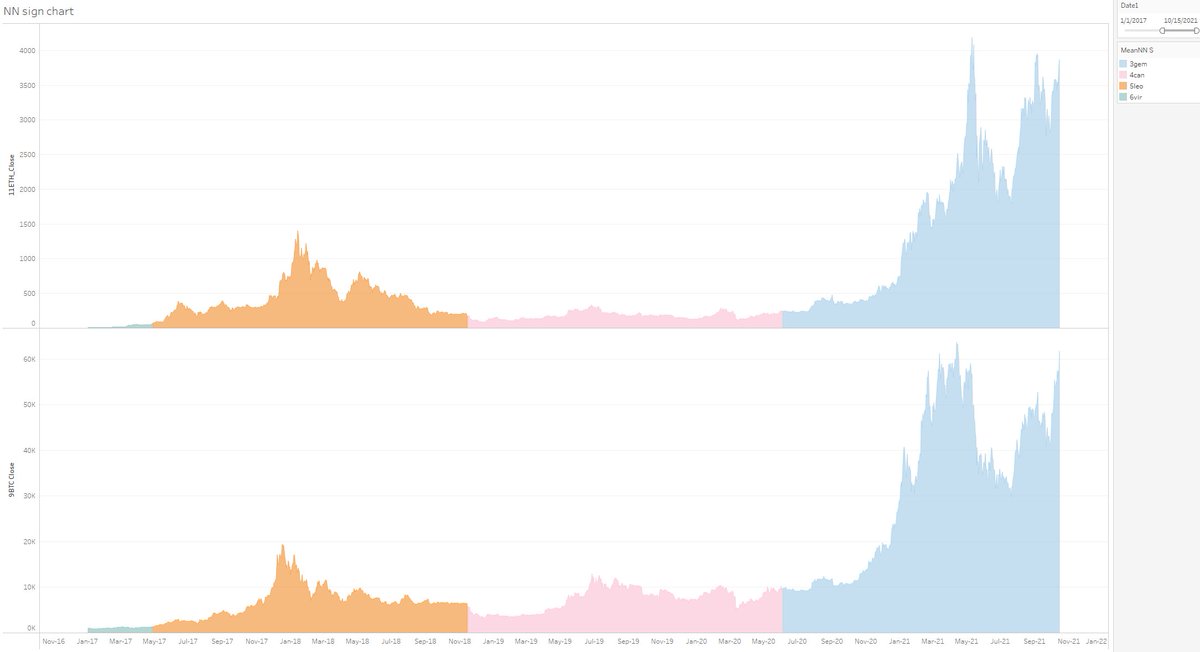
Unique view of planetary motion & price
ETH on top, BTC below, showing planets in tropical zodiac signs with color
Weekly visual update Saturdays
Detailed astro & markets Sundays
I combine technicals & timing to understand markets
Thread >
Unique view of planetary motion & price
ETH on top, BTC below, showing planets in tropical zodiac signs with color
Weekly visual update Saturdays
Detailed astro & markets Sundays
I combine technicals & timing to understand markets
Thread >
Mars
Mars in Libra moving well
These 2 examples, Mars and Jupiter, show that some of the rulership ideas need to take a back seat to Element & its connection to this market
Mars in Libra moving well
These 2 examples, Mars and Jupiter, show that some of the rulership ideas need to take a back seat to Element & its connection to this market

Mercury motion
Hugely bullish Rx
Will the rally stop on direct? Anything is possible, but I think other positives in play
Hugely bullish Rx
Will the rally stop on direct? Anything is possible, but I think other positives in play

2020-current
BTC avg 15m % return
Moon Quarter - mostly 1 bar 1 quarter
So this is the detail underlying the averages in chart above
BTC avg 15m % return
Moon Quarter - mostly 1 bar 1 quarter
So this is the detail underlying the averages in chart above

Moon signs
2021 only
Mostly 1 bar 1 pass through
Have to say haven't figured all this out
Why Cancer so terrible, then better? Pluto motion?
Why Pisces solid, then 3 in a row down? Jupiter condition maybe, but not sure.
2021 only
Mostly 1 bar 1 pass through
Have to say haven't figured all this out
Why Cancer so terrible, then better? Pluto motion?
Why Pisces solid, then 3 in a row down? Jupiter condition maybe, but not sure.

unroll @threadreaderapp
• • •
Missing some Tweet in this thread? You can try to
force a refresh


