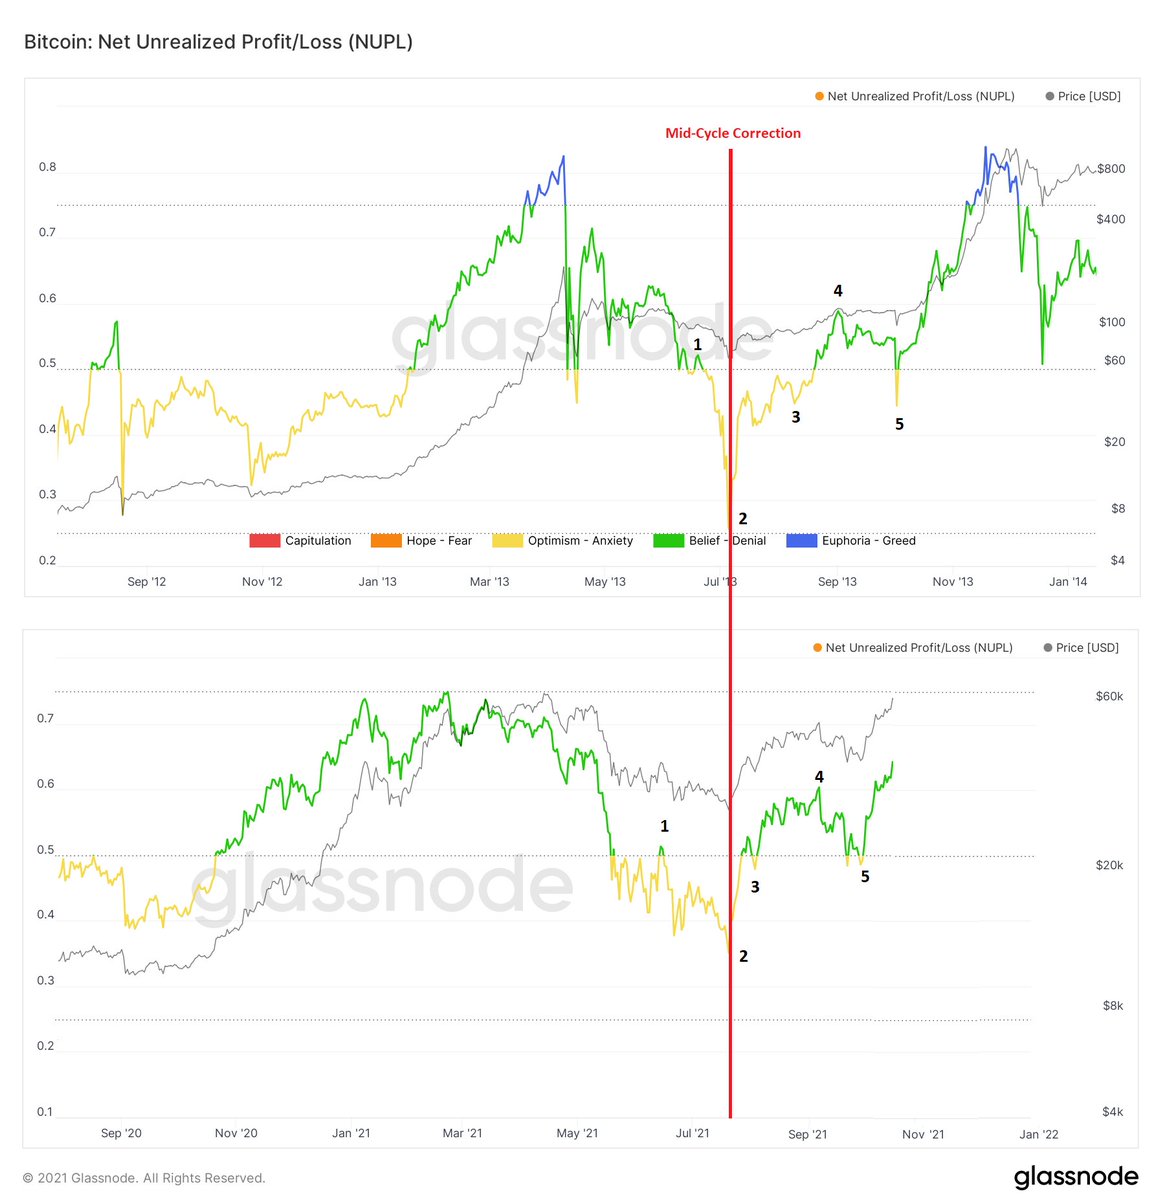
A tale of 3 adjoined arcs

#BTC's price action rhymes in each cycle. Using chart patterns & log fib retracement, the current rally high, point of lift-off to the cycle peak & peak price are determined.

TLDR:
Current Rally high: ~$71K
Lift-off: ~$83K
Cycle Peak: ~$250K
1a/ It is found that in each cycle around this time of the year, #BTC price will form two adjoined arcs similar to a cup & handle pattern.

The height of the smaller arc gives the price increase from the point of breakout to the rally high, which is also called #CTM Wave 2 Peak.
1b/ The height of the larger arc gives the price increase from the point of breakout to the lift-off price level, from which #BTC will rally to its blow-off top.

BTC just broke out of the smaller arc. Thus, the current rally high is ~$71K. The lift-off price level is ~$83K.
2/ It is determined that the lift-off price level has been the 0.235 log Fib retracement from the cycle peak in past cycles.

If history rhymes, it is estimated that the cycle peak is ~$250K, which is within the target price range of the Top Cap Model.

• • •

Missing some Tweet in this thread? You can try to force a refresh
 

Keep Current with Allen Au 🧢

Allen Au 🧢 Profile picture

Stay in touch and get notified when new unrolls are available from this author!

Read all threads

This Thread may be Removed Anytime!

PDF

Twitter may remove this content at anytime! Save it as PDF for later use!

Try unrolling a thread yourself!

how to unroll video
  1. Follow @ThreadReaderApp to mention us!

  2. From a Twitter thread mention us with a keyword "unroll"
@threadreaderapp unroll

Practice here first or read more on our help page!

More from @AllenAu11

18 Oct
#BTC has been consolidating between $59K & $63K. Breaking ATH soon?

TLDR: Yes.
Revisit or even set new ATH ~10/31/21. Max. price for this rally is $70K-$73K
Why?
-Buy & Sell Oscillator & MRGO-14: Buy
-TI: Bullish
-Futures: Bullish w/ some selling
-Options: Bullish
-TA: Bullish
1/ MRGO-14 uses the difference in changes in #BTC's market & realized price to find buy/sell signals for BTC.

Green ➡️ Buy
Red ➡️ Sell

MGRO-14 has flipped green since 10/4/21. Image
2/ My #BTC Buy & Sell Oscillator has been >1 since 10/5/21.

Simple
Oscillator crosses above 1➡️Buy
Oscillator crosses below 1➡️Sell
Oscillator>2➡️Interim/cycle top

Advanced
Oscillator>1 &📈➡️Buy
Oscillator>1 &📉➡️Take profit
Oscillator<1 &📉➡️Short
Oscillator<1 &📈➡️Take profit Image
Read 13 tweets
17 Oct
Here is another example of on-chain data, Net Unrealized Profit/Loss (NUPL), showing similar patterns between #BTC's current cycle and that in 2013 right before & after the mid-cycle correction.

TLDR: BTC could break its ATH by early Nov. 2021.
Cycle peak price: $410K? Image
1/ #BTC's NUPL is the difference between Relative Unrealized Profit and Relative Unrealized Loss. This metric is calculated by subtracting realized cap from market cap, and dividing the result by the market cap. It is a measure of BTC's market sentiment.

medium.com/@adamant_capit…
2a/ We can see that #BTC's NUPL chart shows a 5-wave pattern before & after the mid-cycle correction that is similar in the 2013 & 2021 bull phases.

NUPL Wave 2 ➡️ Mid-Cycle Low Price
NUPL Wave 5 ➡️ #CTM Wave 1 Low Price
Read 5 tweets
14 Oct
𝗖𝗧𝗠 #𝗕𝗧𝗖 𝗢𝗻-𝗖𝗵𝗮𝗶𝗻 𝗠𝗲𝘁𝗿𝗶𝗰 𝗗𝗮𝘀𝗵𝗯𝗼𝗮𝗿𝗱: 𝗪𝗲𝗲𝗸 𝟰𝟬 '𝟮𝟭

Price Action Indicators (Fundamentals that affect BTC's price)

TLDR: 📈
1. Miner metrics- Bullish
2. Supply metrics- Bullish
3. Institution demand- Mod. Bullish
4. Network metrics- Bullish
𝟭. 𝗠𝗶𝗻𝗲𝗿 𝗠𝗲𝘁𝗿𝗶𝗰𝘀
a(i) The hash rate for #BTC miners continues to recover after the China mining ban. This has caused a global reshuffle of BTC mining hash rate such that the US has now emerged as the global leader in BTC mining as per the latest report from CCAF.
1a(ii) Technically, the #BTC hash rate forms an ascending channel. It challenged the key resistance level at 177E, which is also near the top of the channel, but got rejected. It's since recovered & is again on a run to challenge the resistance. Bullish!
Read 15 tweets
13 Oct
𝗖𝗧𝗠 #𝗕𝗧𝗖 𝗢𝗻-𝗖𝗵𝗮𝗶𝗻 𝗠𝗲𝘁𝗿𝗶𝗰 𝗗𝗮𝘀𝗵𝗯𝗼𝗮𝗿𝗱: 𝗪𝗲𝗲𝗸 𝟰𝟬 '𝟮𝟭

𝗣𝗲𝗮𝗸 𝗜𝗻𝗱𝗶𝗰𝗮𝘁𝗼𝗿𝘀 (𝟭𝟭 this wk)

TLDR: BTC hasn't peaked or is in its bear phase.
The 30D MA metrics, RHODL, & NUPL indicate that BTC has exited #CTM Wave 1* low & onto Wave 2*.

*👇
𝟭 𝗕𝘂𝗹𝗹 𝗣𝗵𝗮𝘀𝗲 𝗧𝗼𝗽 & 𝗕𝗲𝗮𝗿 𝗣𝗵𝗮𝘀𝗲 𝗕𝗼𝘁𝘁𝗼𝗺

𝟭𝗮. 𝗧𝗼𝗽 𝗖𝗮𝗽 𝗠𝗼𝗱𝗲𝗹
This model is based on Willy Woo's Top Cap Model for tracking the peak & the bottom tracker is based on #BTC's moving average price.

BTC has neither peaked nor is it in a bear phase.
𝟭𝗯. 𝗙𝗶𝗯 𝗠𝘂𝗹𝘁𝗶𝗽𝗹𝗶𝗲𝗿𝘀
This model is based on Fib retracement & extension numbers as multiples of the 350D SMA of #BTC's price.

BTC has neither peaked nor is it in a bear phase.
Read 15 tweets
13 Oct
The Pi Cycle Top indicator has been accurate in picking out #BTC's tops. If #BTC's cycle peak were to occur in Dec. 2021, would it work?

TLDR: No, unless BTC will perform way better than in past cycles from the mid-cycle correction low with a blow-off top >$500K in Dec. 2021. Image
1/ The Pi Cycle Top indicator has been accurate in picking the timing of #BTC's tops within +/- 3 days. It uses the 111-day simple moving average (111SMA) & the 350SMAx2 of BTC's price. When the 111SMA moves up and crosses the 350SMAx2, that is when BTC's price reaches a top.
2/ Assume #BTC will reach its cycle peak in December 2021, 3 past BTC price data sets scaled from the mid-cycle correction low are used to test if the Pi Cycle Top could pick out the peak in 2021.

a. 2013
b. 2017
b. Average of 2013 & 2017
Read 12 tweets
11 Oct
I have built a simple model for tracking #BTC's cycle top & bottom. This is inspired by Philip Swift's Golden Ratio Multiplier, but I use Fib retracement & extension numbers as multiples instead.

Top: Between 5.618 & 8.618 Fib Lines
Bottom: 0.382 Fib Line
Cycle top: $260K-$410K?
Notes:
1. The model is built simply using the 350D simple moving average (SMA) of #BTC's price. From this, we use Fib retracement & extension numbers as multiples of the 350D SMA of BTC's price to arrive at various lines, namely 0.382, 2.618, 3.618, 5.618, 8.618, 13.618.
2. In the original Golden Ratio Multiplier model, it is noted that each top of #BTC was hitting decreasing Fib sequence multiples of 350D SMA (21, 13, 8, 5, 3) so the current cycle peak should be in the range of 2x. Although this makes sense, I don't think this will happen. Why?
Read 10 tweets

Did Thread Reader help you today?

Support us! We are indie developers!


This site is made by just two indie developers on a laptop doing marketing, support and development! Read more about the story.

Become a Premium Member ($3/month or $30/year) and get exclusive features!

Become Premium

Too expensive? Make a small donation by buying us coffee ($5) or help with server cost ($10)

Donate via Paypal Become our Patreon

Thank you for your support!

Follow Us on Twitter!

:(