𝗖𝗧𝗠 #𝗕𝗧𝗖 𝗢𝗻-𝗖𝗵𝗮𝗶𝗻 𝗠𝗲𝘁𝗿𝗶𝗰 𝗗𝗮𝘀𝗵𝗯𝗼𝗮𝗿𝗱: 𝗪𝗸𝘀 𝟰𝟭 & 𝟰𝟮 '𝟮𝟭
𝗣𝗲𝗮𝗸 𝗜𝗻𝗱𝗶𝗰𝗮𝘁𝗼𝗿𝘀
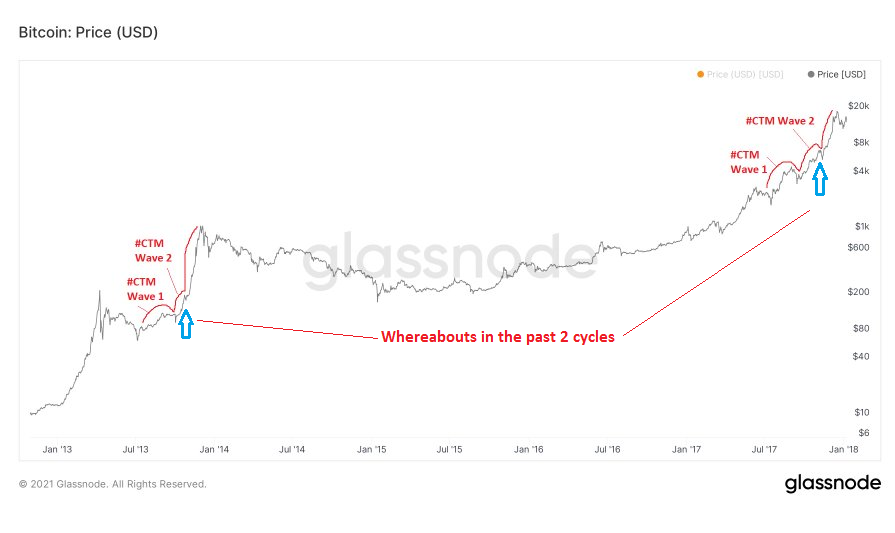
TLDR: BTC broke its ATH so it isn't in its bear phase as shown repeatedly here.
5 indicators show that BTC is on #CTM Wave 2 & on its way to its cycle peak.
𝗣𝗲𝗮𝗸 𝗜𝗻𝗱𝗶𝗰𝗮𝘁𝗼𝗿𝘀
TLDR: BTC broke its ATH so it isn't in its bear phase as shown repeatedly here.
5 indicators show that BTC is on #CTM Wave 2 & on its way to its cycle peak.
𝟭 𝗕𝘂𝗹𝗹 𝗣𝗵𝗮𝘀𝗲 𝗧𝗼𝗽 & 𝗕𝗲𝗮𝗿 𝗣𝗵𝗮𝘀𝗲 𝗕𝗼𝘁𝘁𝗼𝗺
𝟭𝗮. 𝗧𝗼𝗽 𝗖𝗮𝗽 𝗠𝗼𝗱𝗲𝗹
This model is based on Willy Woo's Top Cap Model for tracking the peak & the bottom tracker is based on #BTC's moving average price.
BTC hasn't peaked yet.
𝟭𝗮. 𝗧𝗼𝗽 𝗖𝗮𝗽 𝗠𝗼𝗱𝗲𝗹
This model is based on Willy Woo's Top Cap Model for tracking the peak & the bottom tracker is based on #BTC's moving average price.
BTC hasn't peaked yet.

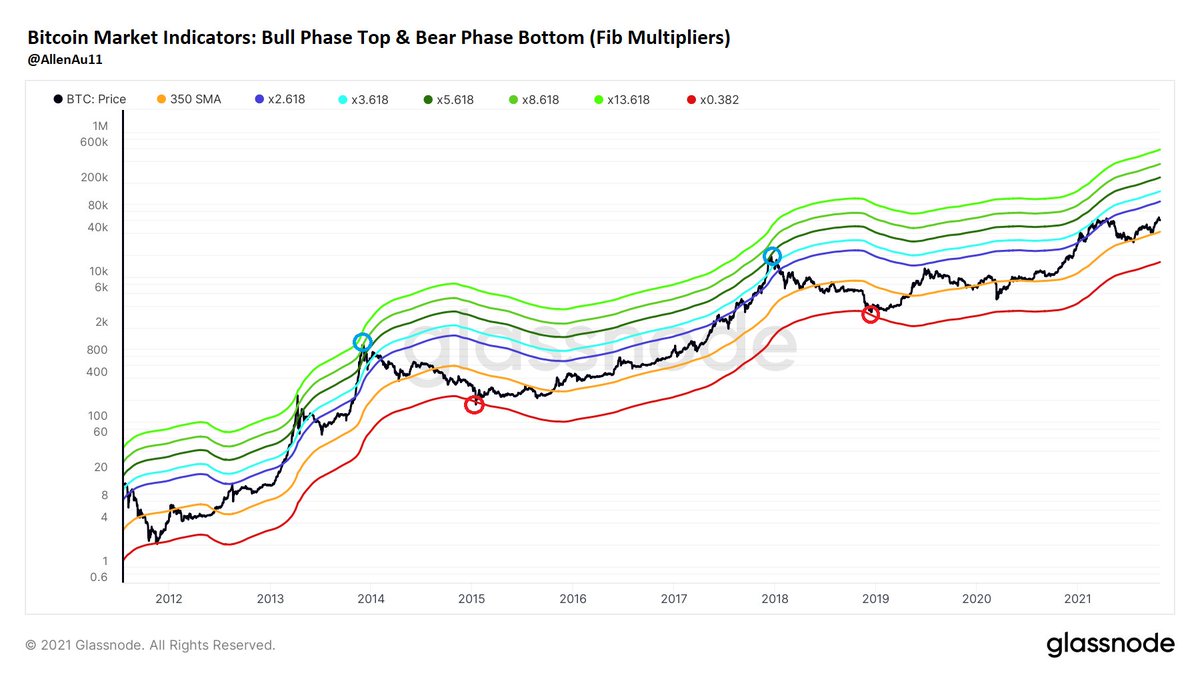
𝟭𝗯. 𝗙𝗶𝗯 𝗠𝘂𝗹𝘁𝗶𝗽𝗹𝗶𝗲𝗿𝘀
This model is based on Fib retracement & extension numbers as multiples of the 350D SMA of #BTC's price.
BTC hasn't peaked yet.
This model is based on Fib retracement & extension numbers as multiples of the 350D SMA of #BTC's price.
BTC hasn't peaked yet.
𝟮. 𝟲𝟬-𝗗𝗮𝘆 𝗩𝗼𝗹𝗮𝘁𝗶𝗹𝗶𝘁𝘆: 𝗖𝗼𝘂𝗻𝘁𝗱𝗼𝘄𝗻 𝘀𝘁𝗮𝗿𝘁𝗲𝗱? 𝗡𝗼
When 60D VVOL crosses V2 again, #BTC is expected to peak within 60 days. It is closing in on V1!👀
* Please read 2(i)(a) of pinned tweet about using the 60D VVOL metric for determining BTC cycle tops.
When 60D VVOL crosses V2 again, #BTC is expected to peak within 60 days. It is closing in on V1!👀
* Please read 2(i)(a) of pinned tweet about using the 60D VVOL metric for determining BTC cycle tops.

𝟯. 𝗨𝗦 𝗜𝗻𝘀𝘁𝗶𝘁𝘂𝘁𝗶𝗼𝗻𝗮𝗹 #𝗕𝗧𝗖 𝗣𝘂𝗿𝗰𝗵𝗮𝘀𝗲 𝗣𝗮𝘁𝘁𝗲𝗿𝗻 (>𝟬.𝟬𝟬𝟱𝟯)
𝗡𝗼
* Please read 2(ii)(e) of pinned tweet for details about this metric to determine BTC topping pattern & whether cycle peak is imminent.
𝗡𝗼
* Please read 2(ii)(e) of pinned tweet for details about this metric to determine BTC topping pattern & whether cycle peak is imminent.

𝟰𝗮. 𝗠𝗩𝗥𝗩-𝗭 𝗦𝗰𝗼𝗿𝗲 (>𝟳.𝟱): 𝗡𝗼
10/16: 2.6*
10/23: 2.4*
*This is similar to that when #BTC was on #CTM Wave 2 of the 2013 bull phase.
This metric went up to 3 on 10/20/21 coinciding when BTC broke its ATH. There is no question that BTC isn't in a bear phase.
10/16: 2.6*
10/23: 2.4*
*This is similar to that when #BTC was on #CTM Wave 2 of the 2013 bull phase.
This metric went up to 3 on 10/20/21 coinciding when BTC broke its ATH. There is no question that BTC isn't in a bear phase.

𝟰𝗯. 𝗠𝗩𝗥𝗩-𝗭 𝗦𝗰𝗼𝗿𝗲 (𝟯𝟬-𝗗𝗮𝘆 𝗠𝗔) (𝗪𝗮𝘃𝗲 𝟱): 𝗬𝗲𝘀
This corresponds to that when #BTC is on #CTM Wave 2.
* BTC is on its way to its cycle peak.
This corresponds to that when #BTC is on #CTM Wave 2.
* BTC is on its way to its cycle peak.

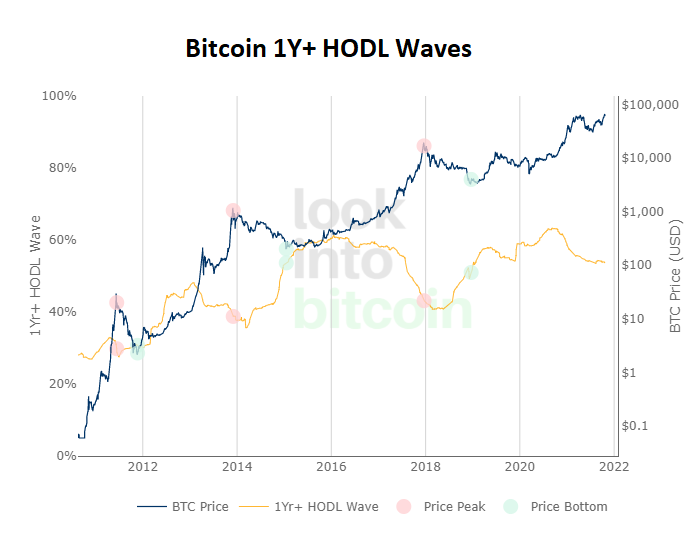
𝟱.𝟭-𝗬𝗿+ 𝗛𝗢𝗟𝗗 𝗪𝗮𝘃𝗲 (~𝟰𝟳%): 𝗡𝗼
10/16 & 10/23: 54%
10/16 & 10/23: 54%
𝟲𝗮. 𝗥𝗲𝘀𝗲𝗿𝘃𝗲 𝗥𝗶𝘀𝗸 (>𝟬.𝟬𝟮): 𝗡𝗼
10/16 & 10/23: 0.005*
The chart pattern is similar to that when #BTC was on #CTM Wave 2 of the 2013 bull phase.
10/16 & 10/23: 0.005*
The chart pattern is similar to that when #BTC was on #CTM Wave 2 of the 2013 bull phase.

𝟲𝗯. 𝗥𝗲𝘀𝗲𝗿𝘃𝗲 𝗥𝗶𝘀𝗸 (𝟯𝟬-𝗗𝗮𝘆 𝗠𝗔) (𝗪𝗮𝘃𝗲 𝟱): 𝗬𝗲𝘀
This corresponds to that when #BTC is on #CTM Wave 2.
* BTC is on its way to its cycle peak.
This corresponds to that when #BTC is on #CTM Wave 2.
* BTC is on its way to its cycle peak.

𝟳. 𝗥𝗲𝗮𝗹𝗶𝘇𝗲𝗱 𝗛𝗢𝗗𝗟 𝗥𝗮𝘁𝗶𝗼 (𝗥𝗛𝗥) (>𝟰𝟬𝗞): 𝗡𝗼
10/16: 11185*
10/23: 13605*
* RHR is similar to that when #BTC was on #CTM Wave 2 of the 2013 & 2017 bull phases.
The chart pattern is similar to that in 2013.
10/16: 11185*
10/23: 13605*
* RHR is similar to that when #BTC was on #CTM Wave 2 of the 2013 & 2017 bull phases.
The chart pattern is similar to that in 2013.

𝟴. 𝗥𝗲𝗮𝗹𝗶𝘇𝗲𝗱 𝗖𝗮𝗽 𝗛𝗢𝗗𝗟 𝗪𝗮𝘃𝗲𝘀 (𝟯𝗿𝗱 𝗪𝗮𝘃𝗲):
𝗪𝗮𝘃𝗲 𝟭
* It looks like RC HODL Waves has entered Wave 2 of the 3-Wave pattern & this will be accompanied by the next leg up in #BTC's bull phase.
𝗪𝗮𝘃𝗲 𝟭
* It looks like RC HODL Waves has entered Wave 2 of the 3-Wave pattern & this will be accompanied by the next leg up in #BTC's bull phase.

𝟵𝗮. 𝗣𝘂𝗲𝗹𝗹 𝗠𝘂𝘁𝗶𝗽𝗹𝗲 (>𝟰): 𝗡𝗼
10/16: 1.43
10/23: 1.52
10/16: 1.43
10/23: 1.52

𝟵𝗯. 𝗣𝘂𝗲𝗹𝗹 𝗠𝘂𝗹𝘁𝗶𝗽𝗹𝗲 (𝟯𝟬-𝗗𝗮𝘆 𝗠𝗔) (𝗪𝗮𝘃𝗲 𝟱): 𝗬𝗲𝘀
This corresponds to that when #BTC is on #CTM Wave 2.
* BTC is on its way to its cycle peak.
This corresponds to that when #BTC is on #CTM Wave 2.
* BTC is on its way to its cycle peak.

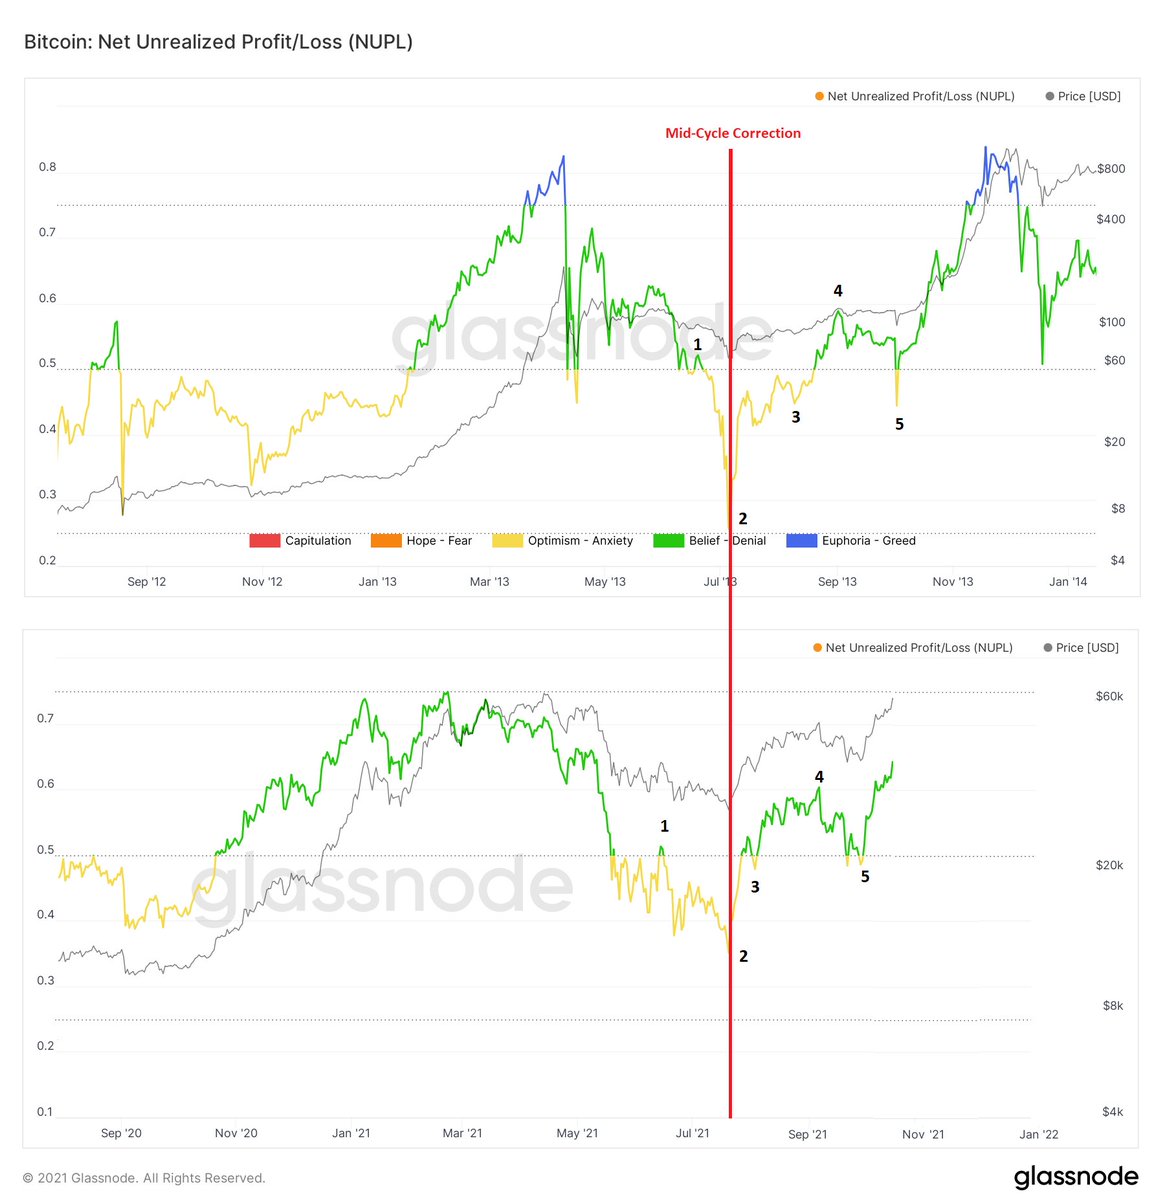
𝟭𝟬. 𝗡𝗨𝗣𝗟 (𝗕𝗹𝘂𝗲): 𝗡𝗼 𝗘𝘂𝗽𝗵𝗼𝗿𝗶𝗮
10/16: 0.64 (Green)*
10/23: 0.63 (Green)*
* This is similar to that when #BTC was on #CTM Wave 2 of the 2013 & 2017 bull phases.
The chart pattern is similar to that in 2013.
10/16: 0.64 (Green)*
10/23: 0.63 (Green)*
* This is similar to that when #BTC was on #CTM Wave 2 of the 2013 & 2017 bull phases.
The chart pattern is similar to that in 2013.

• • •
Missing some Tweet in this thread? You can try to
force a refresh