
🐻♉️↗️↘️↔️⚠️🚩🔺🔻🧮
Global Macro Review - October 2021
1/15
Crude 🚀 along with domestic equities as vol ↘️
The 10/2 curve ↗️ then ↘️ sharply with short-end 🚀
Grains ↗️ with 🌽 &🌾💪🏼
AUD 🦘🔺 and JPY 🈹 🔻
Let’s dig in to the 🧮!
Global Macro Review - October 2021
1/15
Crude 🚀 along with domestic equities as vol ↘️
The 10/2 curve ↗️ then ↘️ sharply with short-end 🚀
Grains ↗️ with 🌽 &🌾💪🏼
AUD 🦘🔺 and JPY 🈹 🔻
Let’s dig in to the 🧮!

3/15
🛢 and ⛽️ 🚀 to new cycle highs while Natty 🪓 at 6.47
$WTIC 83.57 +11.38%
$BRENT 84.38 +7.46%
$GASO 2.37 +8.22%
$NATGAS 5.43 -7.52%
Chart: $WTIC +11.38% for October is up 72% in 2021
🛢 and ⛽️ 🚀 to new cycle highs while Natty 🪓 at 6.47
$WTIC 83.57 +11.38%
$BRENT 84.38 +7.46%
$GASO 2.37 +8.22%
$NATGAS 5.43 -7.52%
Chart: $WTIC +11.38% for October is up 72% in 2021

3a/15
$NATGAS -7.52% found resistance at the February 2014 🔝 and ↘️
The question remains, does Natty have 🦵🦵 to break thru?
Chart: 10-year chart of $NATGAS
$NATGAS -7.52% found resistance at the February 2014 🔝 and ↘️
The question remains, does Natty have 🦵🦵 to break thru?
Chart: 10-year chart of $NATGAS

4/15
SILVER led metals higher in October but along with the others remains 🐻 trend (3-month price momentum)
$SILVER 23.95 +8.62%
$COPPER 4.37 +6.85%
$PLAT 1021 +6.06%
$GOLD 1784 +1.53%
Chart: COPPER thwarted at 4.82 and is now -2.46% over (T) duration
SILVER led metals higher in October but along with the others remains 🐻 trend (3-month price momentum)
$SILVER 23.95 +8.62%
$COPPER 4.37 +6.85%
$PLAT 1021 +6.06%
$GOLD 1784 +1.53%
Chart: COPPER thwarted at 4.82 and is now -2.46% over (T) duration

5/15
Grains with a ↔️ performance, but only $SOYB remains 🐻 trend
$WHEAT 773 +6.51%
$CORN 568 +5.87%
$SOYB 1249 -0.52%
$SUGAR 19.29 -2.82%
Chart: $CORN 🌽 is +4.22% over (T) duration ♉️
Grains with a ↔️ performance, but only $SOYB remains 🐻 trend
$WHEAT 773 +6.51%
$CORN 568 +5.87%
$SOYB 1249 -0.52%
$SUGAR 19.29 -2.82%
Chart: $CORN 🌽 is +4.22% over (T) duration ♉️

6/15
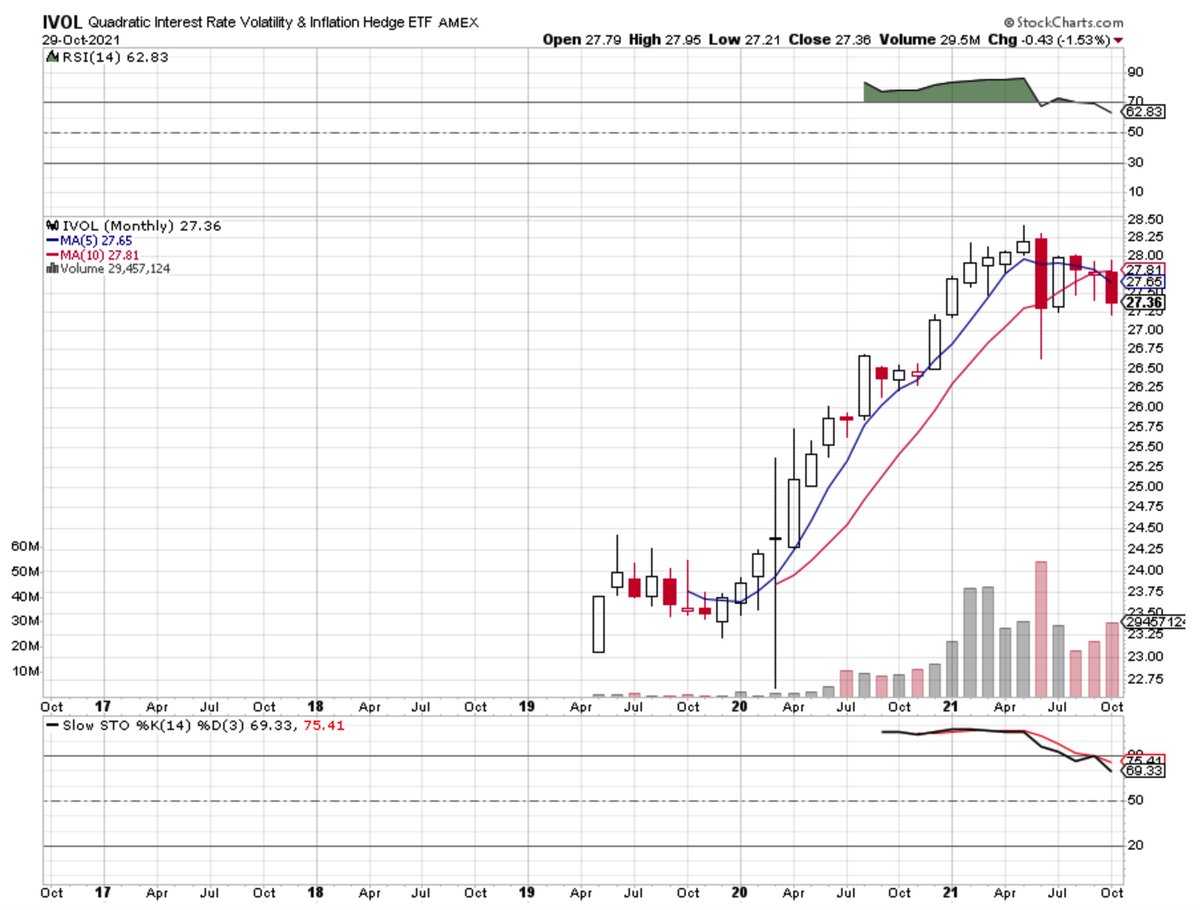
UST yields were a tale of two durations as the 10/2 curve 🏔 at 129 BPS on 10/08 and 🥞 the balance of the month to close at 106 BPS
2Y .501 +21.9 bps
5Y 1.185 +20.5 bps
10Y 1.561 +5.8 bps
30Y 1.939 -12.4 bps
Chart: $IVOL -1.53% as the 🐻 steepener trade failed 😰
UST yields were a tale of two durations as the 10/2 curve 🏔 at 129 BPS on 10/08 and 🥞 the balance of the month to close at 106 BPS
2Y .501 +21.9 bps
5Y 1.185 +20.5 bps
10Y 1.561 +5.8 bps
30Y 1.939 -12.4 bps
Chart: $IVOL -1.53% as the 🐻 steepener trade failed 😰
6a/15
The MOVE 75.45 +14.38 points on the month, suggesting a nervous and hedge bond market coming into #FOMC and #NFP this week.
Chart: YTD MOVE index matching the February high
The MOVE 75.45 +14.38 points on the month, suggesting a nervous and hedge bond market coming into #FOMC and #NFP this week.
Chart: YTD MOVE index matching the February high

7/15
Convertibles and long duration bond ETFs ↗️ on the month
CWB +3.08%
TLT +2.34%
TIP +0.77%
LQD +0.34%
BND -0.08%
IEF -0.51%
HYG -0.64%
IVOL -1.53%
Chart: CWB a TSLA beneficiary
Convertibles and long duration bond ETFs ↗️ on the month
CWB +3.08%
TLT +2.34%
TIP +0.77%
LQD +0.34%
BND -0.08%
IEF -0.51%
HYG -0.64%
IVOL -1.53%
Chart: CWB a TSLA beneficiary

8/15
Major #fx currencies showed some vol towards month end, as AUS EUR CAN all indicated the end of QE or outright ↗️ rates.
$USD 94.12 -0.13%%
$GBP 1.369 +1.63%
$EUR 1.156 -0.17%
$AUD 0.752 +4.01%
$USDCHF 0.915 -1.82%
$USCAD 1.238 -2.37%
$USDJPY 113.99 +2.44%
Chart: $FXA 🚀
Major #fx currencies showed some vol towards month end, as AUS EUR CAN all indicated the end of QE or outright ↗️ rates.
$USD 94.12 -0.13%%
$GBP 1.369 +1.63%
$EUR 1.156 -0.17%
$AUD 0.752 +4.01%
$USDCHF 0.915 -1.82%
$USCAD 1.238 -2.37%
$USDJPY 113.99 +2.44%
Chart: $FXA 🚀

9/15
Volatility drained ↘️ as equity investors remained ♉️ - not sharing the 😱 of bond traders
$VIX 16.26 -6.89 pts
$VXN 19.64 -7.01 pts
$RVX 22.08 -6.81 pts
$VXEEM 20.19 -8.70 pts
Chart: $VIX remains 🐻 and near cycle lows
Volatility drained ↘️ as equity investors remained ♉️ - not sharing the 😱 of bond traders
$VIX 16.26 -6.89 pts
$VXN 19.64 -7.01 pts
$RVX 22.08 -6.81 pts
$VXEEM 20.19 -8.70 pts
Chart: $VIX remains 🐻 and near cycle lows

10/15
Fueled by the decline in long duration bonds, large growth lead US equities ↗️ ♉️
$COMPQ 15498 +7.27% ATH
$SPX 4605 +6.91% ATH
$IWM 228 +4.25%
Chart: $COMPQ +5.63% over (T) duration and +20.25% YTD
Fueled by the decline in long duration bonds, large growth lead US equities ↗️ ♉️
$COMPQ 15498 +7.27% ATH
$SPX 4605 +6.91% ATH
$IWM 228 +4.25%
Chart: $COMPQ +5.63% over (T) duration and +20.25% YTD

11/15
Top US sectors:
XLY +12.09%
XLE +10.33%
XLK +8.18%
XLB +7.6%
XLRE +7.58%
Negative alpha
XLC +0.24%
XLP +3.5%
XLU +4.74%
Chart: Tesla was the 🔥 behind the out performance of $XLY
Top US sectors:
XLY +12.09%
XLE +10.33%
XLK +8.18%
XLB +7.6%
XLRE +7.58%
Negative alpha
XLC +0.24%
XLP +3.5%
XLU +4.74%
Chart: Tesla was the 🔥 behind the out performance of $XLY

12/15
It was a ↔️ bag in major internat’l market indices
$CAC 6830 +4.76%
$HSI 25377 +3.26%
$DAX 15689 +2.81%
$SSEC 3547 -0.58%
$NIKK 28893 -1.9%
$KOSPI 2971 -3.2%
Chart: $KOSPI remains 🐻 (t) -1.61% and (T) -7.23% and has been a great short
It was a ↔️ bag in major internat’l market indices
$CAC 6830 +4.76%
$HSI 25377 +3.26%
$DAX 15689 +2.81%
$SSEC 3547 -0.58%
$NIKK 28893 -1.9%
$KOSPI 2971 -3.2%
Chart: $KOSPI remains 🐻 (t) -1.61% and (T) -7.23% and has been a great short

13/15
Top performing country ETFs
IDX +8.62% 🇮🇩
EWC +7.84% 🇨🇦
NOR +6.84% 🇳🇴
EWD +6.82% 🇸🇪
Worst performers
EWZ -8.75% 🇧🇷
EWJ -2.63% 🇯🇵
EWY -1.45%% 🇰🇷
Chart: $IDX +8.68% (t) and +14.75% (T) ♉️ ♉️
Top performing country ETFs
IDX +8.62% 🇮🇩
EWC +7.84% 🇨🇦
NOR +6.84% 🇳🇴
EWD +6.82% 🇸🇪
Worst performers
EWZ -8.75% 🇧🇷
EWJ -2.63% 🇯🇵
EWY -1.45%% 🇰🇷
Chart: $IDX +8.68% (t) and +14.75% (T) ♉️ ♉️

14/15
So, as we 👀 ahead to November, you need not look far to see what stands in the way of this #reflation trade.
#FOMC on Wednesday and #NFP on Friday.
The big ❓
Will the #FOMC do its job to ↘️ #inflation, as we clearly are at full employment
So, as we 👀 ahead to November, you need not look far to see what stands in the way of this #reflation trade.
#FOMC on Wednesday and #NFP on Friday.
The big ❓
Will the #FOMC do its job to ↘️ #inflation, as we clearly are at full employment

15/15
The bond market sees rates ↗️ and future #growth and #inflation ↘️ - hence the 🥞 curve and the ↗️ MOVE
Equity investors showing no 😱 with VIX 16
Let’s see what unfolds.
Meanwhile have a great 🎃!
The bond market sees rates ↗️ and future #growth and #inflation ↘️ - hence the 🥞 curve and the ↗️ MOVE
Equity investors showing no 😱 with VIX 16
Let’s see what unfolds.
Meanwhile have a great 🎃!
• • •
Missing some Tweet in this thread? You can try to
force a refresh


