Sona Comstar
Sona BLW Precision Forgings Ltd
Let us understand the business first and also connect the dots why market is valuing it so richly almost at par with few OEMs.
Have done a detailed presentation on the same. Ready to discuss, exchange data and learnings.
#sonacoms
Sona BLW Precision Forgings Ltd
Let us understand the business first and also connect the dots why market is valuing it so richly almost at par with few OEMs.
Have done a detailed presentation on the same. Ready to discuss, exchange data and learnings.
#sonacoms
21/n
Conclusion & Estimates
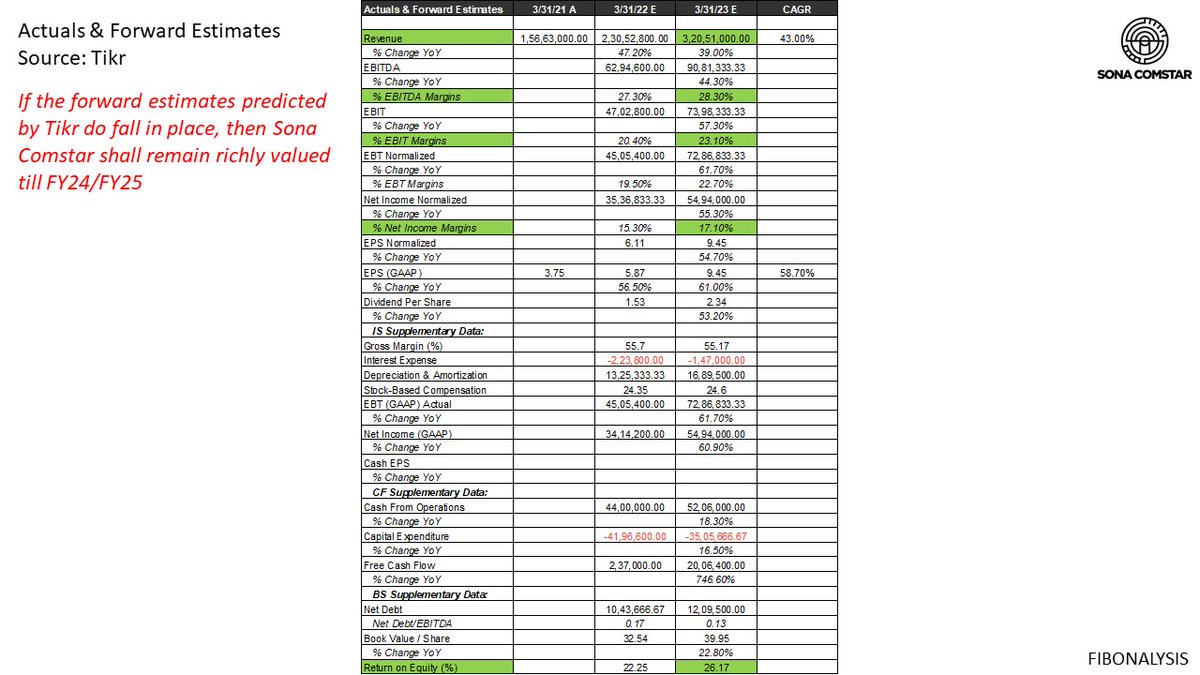
Slides 74-75
This concludes an exhaustive presentation on Sona Coms.
Hopefully have been able able to connect some dots and create better understanding of the company.
#investing
#technofunda
#Investment
#StockMarket
#stocks
#Fibonalysis

Conclusion & Estimates
Slides 74-75
This concludes an exhaustive presentation on Sona Coms.
Hopefully have been able able to connect some dots and create better understanding of the company.
#investing
#technofunda
#Investment
#StockMarket
#stocks
#Fibonalysis


• • •
Missing some Tweet in this thread? You can try to
force a refresh


