IG Design #IGR was a ten bagger in the 5 years leading up to Covid. An update a fortnight ago dropped the shares by half and erased all the gains in the most recent five years. Knife catching and broken growth this soon is almost always a mistake but IG may be an exception here. 


My basic premise with it is that the accounts are a complicated nightmare (CTRL+f for "adjust" is 232 hits in the last FY report) but most immediately, that this is right now a gross margin story - I think there are grounds to at least consider whether IG can be given a pass here
Unfortunately, it does mean walking through it so grab a.. (just no) so anyway, here's the rough idea: Pre-covid in white, M&A growth darling, 20% gross margins. Forget the op margin for now - I'm stripping out the adjustments that made adjusted whatever go up and to the right 

In the doghouse, it's cold, hard, unadjusted statutory.
Let's look at covid - the first grey period: company closed a massive US acquisition (called CSS) 1 month before period end, the Trump tariffs came in, Covid began. Gross margins 9.9%. H2/20 explained.
Let's look at covid - the first grey period: company closed a massive US acquisition (called CSS) 1 month before period end, the Trump tariffs came in, Covid began. Gross margins 9.9%. H2/20 explained.

Now, here's the first of 2 datapoints that I think are worth a look: H1/21 covering the height of the first wave of Covid produces a 19.3% margin. What do they have to say about it? 

Q1 of H1 down -28% in core IGR, CSS down -12%
Q2 of H1 down -3% in core IGR, CSS up 2%
Gross margins impacted by mix and manufacturing decrementals
Not a sunny situation yet despite all that, gross margins are at 19.3% - in the circumstances, for me it's very creditable
Q2 of H1 down -3% in core IGR, CSS up 2%
Gross margins impacted by mix and manufacturing decrementals
Not a sunny situation yet despite all that, gross margins are at 19.3% - in the circumstances, for me it's very creditable

Post period, they got hacked and they'll lose some sales and incur costs. Fine, if this is cheap there's going to be problems. 

LfLs down -5% overall in the year, CSS down -1%,
Hacking incurs costs, reduces sales as expected
Further mention of mix: self manufactured in core IGR vs bought in is down disproportionally so lower absorption.


Hacking incurs costs, reduces sales as expected
Further mention of mix: self manufactured in core IGR vs bought in is down disproportionally so lower absorption.


Here's my point: despite it going nowhere fast - ex growth, weak LfLs, core IGR maybe festering, manufacturing side (and therefore GM relevant) hit most, during Covid, costs increasing - we're *still* at 16% GMs. Sure, it's crap and I don't want to own it but see what comes next.
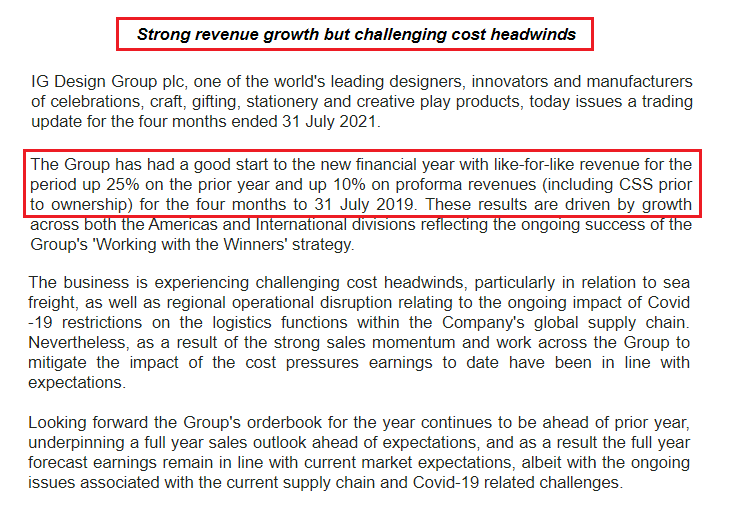
Late August update 2021, covering the first 4 months of H1/22: "challenging cost headwinds" - but the growth has picked up: +25% on the LfLs, +10% proforma for CSS. Sure, not stellar but much better, absent the costs I'd expect an improvement on that 16% but we'll never know.. 

..because 8 weeks later, in late October, a further update - and this is the full house: costs up, logistics screwed, sales down so sharply the H1 numbers are less than half of what they were due to be just 2 months ago and the whole year's a write-off. Pure, unmitigated disaster 

Now, here's the period covered by those two updates on a generic chart of China - US shipping costs.
Light grey, cost headwinds but growth coming back (and absent those costs, you assume at least some margin); dark grey final cost spike, backlogs now impacting sales? Perhaps
Light grey, cost headwinds but growth coming back (and absent those costs, you assume at least some margin); dark grey final cost spike, backlogs now impacting sales? Perhaps

Can we look through this all? What happens if we do and assume a situation sometime into 2022 just with 21/H2's revenue and 21/H2's opex but we flex the gross margins around? We get £10-17M per half in operating income. 

Perhaps more likely, rather than cost pressures just dissipating alone we might expect to see a bit of that update 1 growth come back to help improve those margins - below is +10% on H2 revenues with a flat expense base. £15-23M per half. I know.. it's just generalising 

Suppose even, we went back to before those shipping costs spiked and went by management's new target of $1.5B in medium-term sales and $150M in EBITDA? Could we risk the wait? Ex-M&A the company is running with 0 net debt, balance sheet suggests to me no financial distress at all 

Midpoint of that first scenario is £28M operating annualised, second is £39M, the company target in EBITDA (and recently changed into USD...) before the shipping chart is £110M - against a market cap of £230M
I've banged on about the 2nd derivative before; what would shock more than those last 8 weeks? The year is over already and next year is already guided to be rocky. The rose-tinted glasses are on here but it's a turnaround idea - strap them on, grin and bear it.
In an expensive market, this is what I'm reduced to - the excuses I make on behalf of IGR may or may not be justified but stabilise at this price, with ¼ off the low end of the base scenario - it's an 11 PE. With synergies, growth, the upside could be far more than substantial.
• • •
Missing some Tweet in this thread? You can try to
force a refresh


