"Trading Divergences in RSI."
In this thread 🧵, we will discuss:
1. What is Divergence
2. Why are they formed
3. Types of Divergences
4. #Trading RSI Divergence
In this thread 🧵, we will discuss:
1. What is Divergence
2. Why are they formed
3. Types of Divergences
4. #Trading RSI Divergence
1/n
I had discussed #RSI indicator in my last thread.
If you have not read about RSI, I will encourage you to read about that first before learning about Divergence
I had discussed #RSI indicator in my last thread.
If you have not read about RSI, I will encourage you to read about that first before learning about Divergence
https://twitter.com/kaushikaki/status/1467134735117922309?s=20
2/n
What is a #Divergence?
It is when price & indicator are giving a different set of information. For instance, if price is going higher but indicator is not or viceversa, this shows that there is a dispute. In ideal case scenario – If price making high, indicator should also
What is a #Divergence?
It is when price & indicator are giving a different set of information. For instance, if price is going higher but indicator is not or viceversa, this shows that there is a dispute. In ideal case scenario – If price making high, indicator should also
3/n
So, in a nutshell, #Divergence is the disagreement between the #RSI indicator and the Price of the stock.
So, in a nutshell, #Divergence is the disagreement between the #RSI indicator and the Price of the stock.
4/n
Why are #divergences formed?
The trend is composed of a series of price swings and momentum play an important role in assessing the trend strength. So, they tell us about a possible change in momentum which is now shifting from strong to slowing down /going to get stronger.
Why are #divergences formed?
The trend is composed of a series of price swings and momentum play an important role in assessing the trend strength. So, they tell us about a possible change in momentum which is now shifting from strong to slowing down /going to get stronger.
5/n
We should also keep in mind DECREASE in momentum DOES NOT ALWAYS LEAD TO A REVERSAL, but it does signal something is changing, and the trend may consolidate or reverse.
We use divergence to assess the momentum of the trend and look for possible reversal in the stock price.
We should also keep in mind DECREASE in momentum DOES NOT ALWAYS LEAD TO A REVERSAL, but it does signal something is changing, and the trend may consolidate or reverse.
We use divergence to assess the momentum of the trend and look for possible reversal in the stock price.
6/n
Divergences are always used with Momentum Indicator, as we are interested in assessing the strength of Trends.
I will be using the #RSI indicator moving forwards to explain the concept of Divergence.
Other Momentum indicators are - #Stochastics, #ROC, #MACD, and #ADX
Divergences are always used with Momentum Indicator, as we are interested in assessing the strength of Trends.
I will be using the #RSI indicator moving forwards to explain the concept of Divergence.
Other Momentum indicators are - #Stochastics, #ROC, #MACD, and #ADX
7/n
Types of Divergences:
1. Bullish Divergence
2. Bearish Divergence
3. Bullish Hidden Divergence
4. Bearish Hidden Divergence
5. Exaggerated Bullish Divergence
6. Exaggerated Bearish Divergence
Types of Divergences:
1. Bullish Divergence
2. Bearish Divergence
3. Bullish Hidden Divergence
4. Bearish Hidden Divergence
5. Exaggerated Bullish Divergence
6. Exaggerated Bearish Divergence
8/n
Key points to remember while trading divergence:
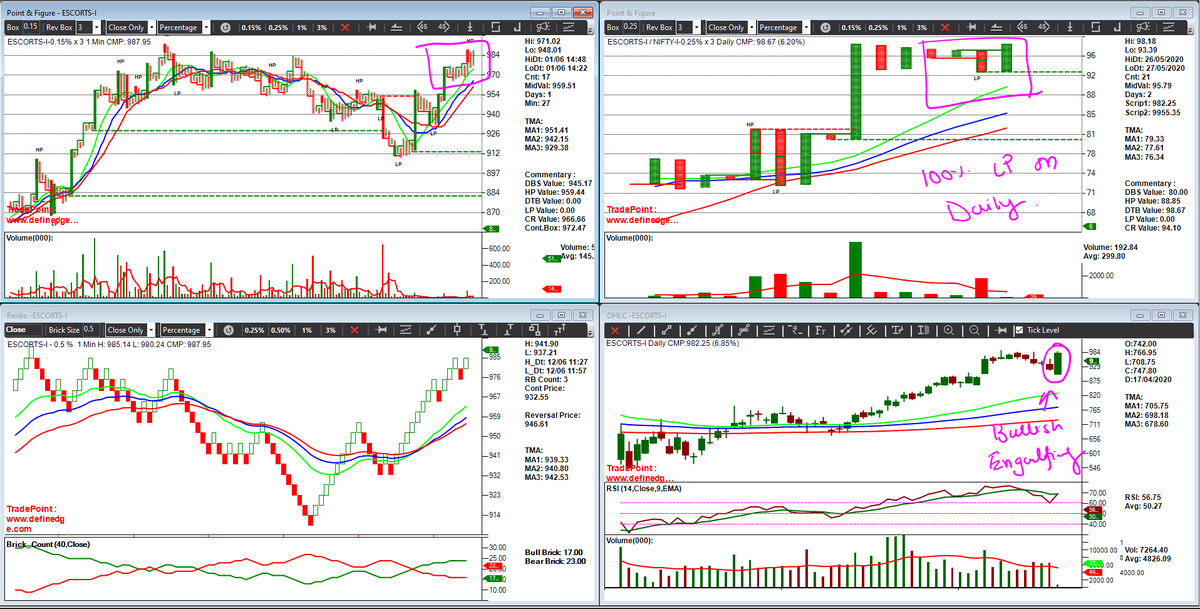
Divergences are plotted on Closing only charts. Why so? Because RSI considers closing values, so our charts (plotting method) should also consider closing values.
The best charts to plot divergences are Line, PnF, and Renko
Key points to remember while trading divergence:
Divergences are plotted on Closing only charts. Why so? Because RSI considers closing values, so our charts (plotting method) should also consider closing values.
The best charts to plot divergences are Line, PnF, and Renko
9/n
In tweet no-5, we understood DIVERGENCE is the change of momentum, so they work best when found on Top or Bottom of the charts
Bullish Divergence at significant LOW and Bearish Divergence at significant HIGH
In tweet no-5, we understood DIVERGENCE is the change of momentum, so they work best when found on Top or Bottom of the charts
Bullish Divergence at significant LOW and Bearish Divergence at significant HIGH
10/n
Bullish Divergence: It signals, the price can move higher from these levels.
FORMATION: It occurs on charts when the stock price makes a Lower-Low but RSI indicator makes a Higher-Low. Should be found at significant LOW of the charts
Bullish Divergence: It signals, the price can move higher from these levels.
FORMATION: It occurs on charts when the stock price makes a Lower-Low but RSI indicator makes a Higher-Low. Should be found at significant LOW of the charts


11/n
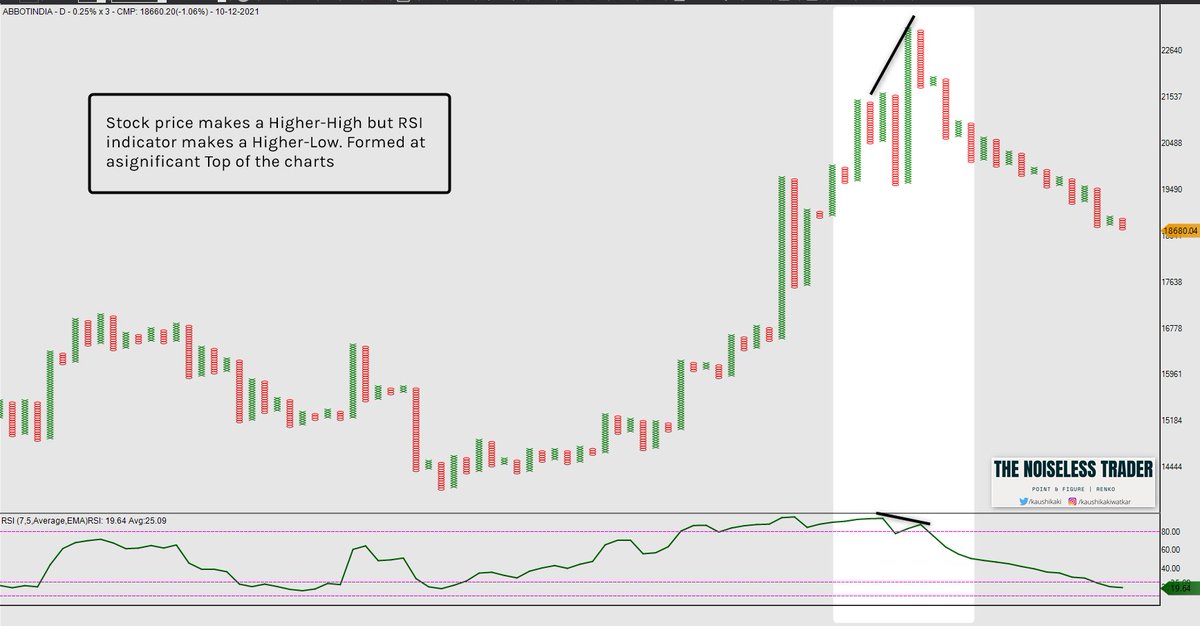
Bearish Divergence: It signals, the price can move lower from these levels.
FORMATION: It occurs on charts when the stock price makes a Higher-High but RSI indicator makes a Higher-Low. Should be found at significant TOP of the charts
Bearish Divergence: It signals, the price can move lower from these levels.
FORMATION: It occurs on charts when the stock price makes a Higher-High but RSI indicator makes a Higher-Low. Should be found at significant TOP of the charts

12/n
Bullish Hidden Divergence is a continuation pattern. It shows that momentum is intact. Bullish stock coming to the Oversold region means it cannot stay here for a prolonged period and it has to bounce back quickly. We discussed this in our recent YouTube Video on RSI.
Bullish Hidden Divergence is a continuation pattern. It shows that momentum is intact. Bullish stock coming to the Oversold region means it cannot stay here for a prolonged period and it has to bounce back quickly. We discussed this in our recent YouTube Video on RSI.
13/n
If you have missed the @YouTubeIndia Live session on Relative Strength Index here is the link:
If you have missed the @YouTubeIndia Live session on Relative Strength Index here is the link:
14/n
Bullish Hidden Divergence is drawn from LOWS to HIGHER SWING LOW and RSI value is compared with previous Swing Low values. It will get further clear with the charts
Bullish Hidden Divergence is drawn from LOWS to HIGHER SWING LOW and RSI value is compared with previous Swing Low values. It will get further clear with the charts


15/n
Bearish Hidden Divergence is a continuation pattern. It shows that momentum is intact. Stock in Bearish trend coming to Overbought region means it cannot stay here for prolong period and it has to bounce back quickly.
Bearish Hidden Divergence is a continuation pattern. It shows that momentum is intact. Stock in Bearish trend coming to Overbought region means it cannot stay here for prolong period and it has to bounce back quickly.

16/n
The term exaggerated refers to a circumstance where either the oscillator or price makes an equal high or low. Regular bullish divergences and regular bearish divergences both have two exaggerated variations, so there are four exaggerated variations in total.
The term exaggerated refers to a circumstance where either the oscillator or price makes an equal high or low. Regular bullish divergences and regular bearish divergences both have two exaggerated variations, so there are four exaggerated variations in total.
17/n
Exaggerated Divergence is a very common type of divergence found. From my experience of scalping Nifty, I have seen these types of divergence very common in NIFTY. I will be explaining the concept of Exaggerated Divergences in my YT live on Wednesday.
Exaggerated Divergence is a very common type of divergence found. From my experience of scalping Nifty, I have seen these types of divergence very common in NIFTY. I will be explaining the concept of Exaggerated Divergences in my YT live on Wednesday.
18/n
Conclusion
-Divergence should be identified on charts plotted using closing values
-Total of 6 types of divergence
-Normal Divergences are Momentum Slowdown or Trend reversal
-Hidden Divergences are trend continuation
-Hidden Divergence - traded with Dynamic S/R works fab
Conclusion
-Divergence should be identified on charts plotted using closing values
-Total of 6 types of divergence
-Normal Divergences are Momentum Slowdown or Trend reversal
-Hidden Divergences are trend continuation
-Hidden Divergence - traded with Dynamic S/R works fab
19/n
Cheat Sheet to Divergence
Cheat Sheet to Divergence

20/n
I will share the application of Divergence and how to trade them with a context in the upcoming YouTube Live on Wednesday.
Make sure you subscribe to my channel youtube.com/c/TheNoiseless…
I will share the application of Divergence and how to trade them with a context in the upcoming YouTube Live on Wednesday.
Make sure you subscribe to my channel youtube.com/c/TheNoiseless…
21/n
If this thread helped you, please re-tweet and help other fellow traders in their learning curve. If you like my content, follow me on @kaushikaki
Join telegram channel: t.me/thenoiselesstr…
If this thread helped you, please re-tweet and help other fellow traders in their learning curve. If you like my content, follow me on @kaushikaki
Join telegram channel: t.me/thenoiselesstr…
• • •
Missing some Tweet in this thread? You can try to
force a refresh